21.7 Chart Tools: Add text, lines and points to graphs
All graphs include controls for adding elements into the graphs - specifically textboxes, lines and points which you can use to label your graphs.
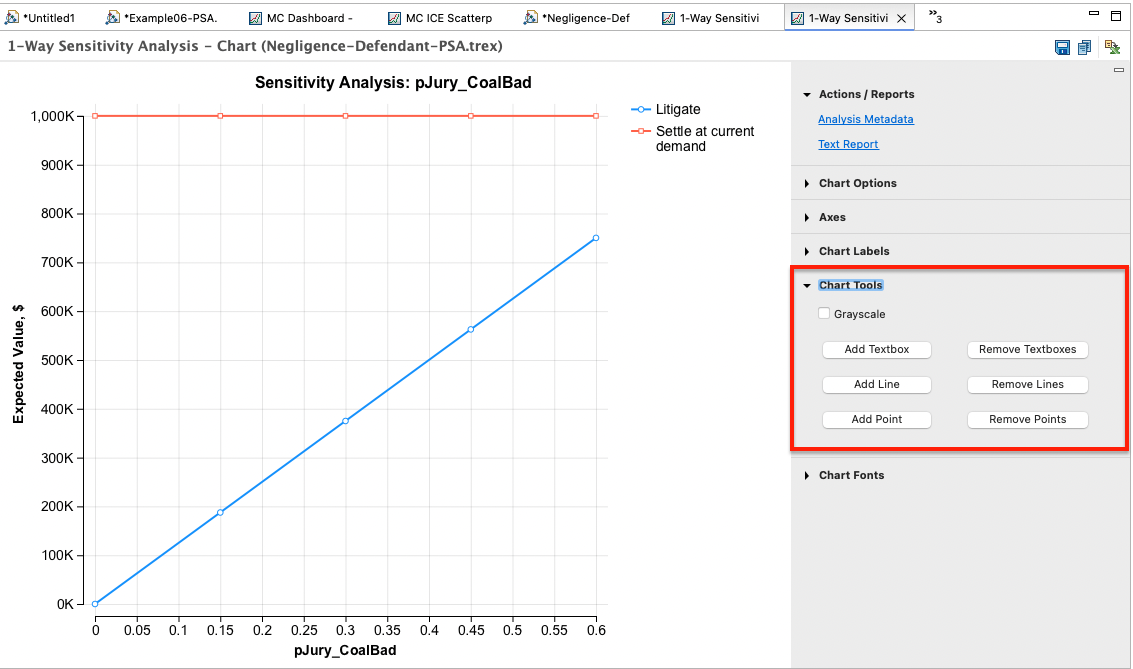
The following controls are available:
-
Add textbox: This adds a textbox which can be dragged and dropped around the graph.
-
Remove textboxes: This removes all the textboxes on the graph.
-
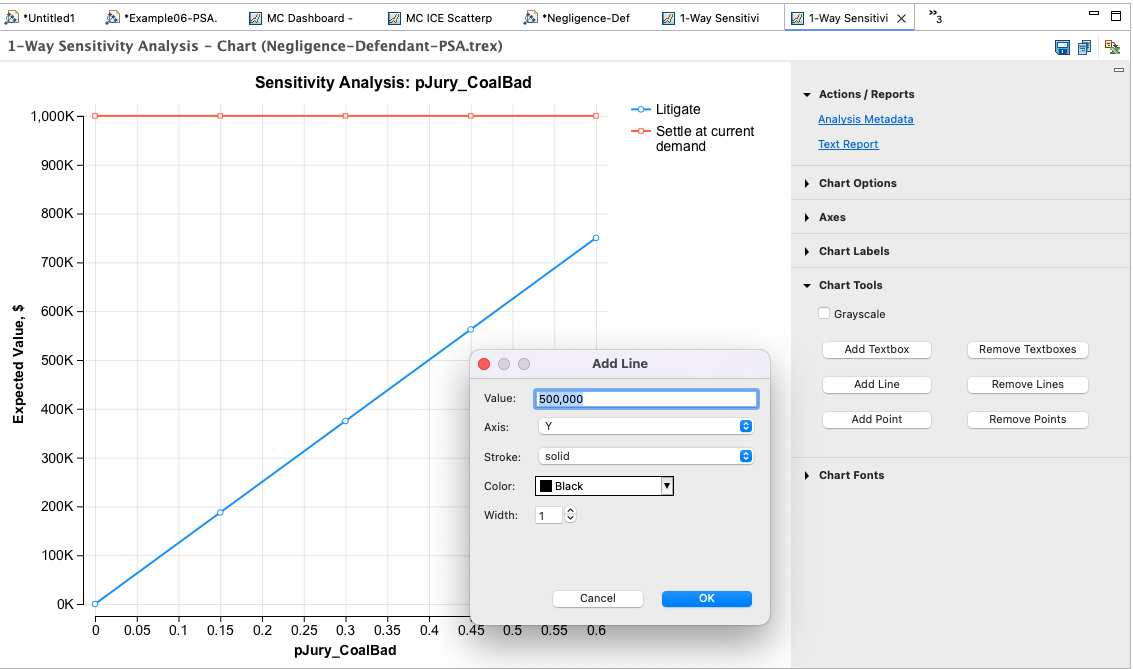
Add line: This adds lines parallel to either the X or Y axis.
-
Remove lines: This removes all lines on the graph.
- Add point: This creates individual points on the graph.
-
Remove points: This removes all individual points on the graph.
-
Deleting individual textboxes or lines: you can remove any individual line or text box by right-clicking on that element and choosing Delete from the context menu.
-
Moving a textbox: Move any text box via click and drag.
The dialog shown below illustrates how to add a line to the graph. Set the value for the appropriate axis, the stroke, color and width of the line.