22.2 Running Microsimulation and Interpreting the Results
Open the Legal tutorial example, BreachOfContract-Microsim.trex, which incorporates distributions resampled per trial. If a model is built using Microsimulation, then it needs to be run using specific Analysis, not the usual Expected Value analysis (for example Rankings).
To run a microsimulation:
-
Select the root node.
-
Choose Analysis > Monte Carlo Simulation > Trials (Microsimulation)... OR
-
Click the single die icon in the Analysis layout tool bar.
-
Enter 1,000 trials in the Monte Carlo Simulation dialog.
-
We want the Average values returned for the trial set, so leave the Average button selected. Select Begin.
-
By default the stabilize strategies checkbox is checked, so the trials will take similar paths through similar strategies, as in the image below.
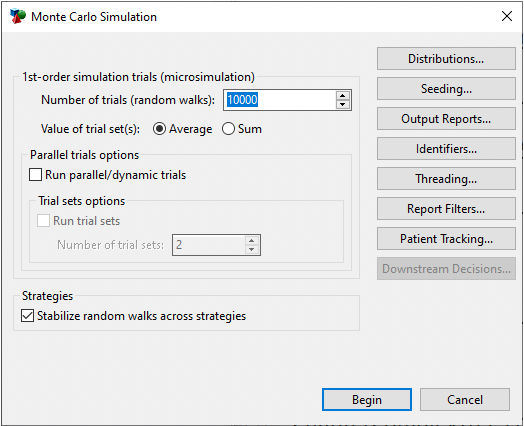
Stabilize random walks across strategies: When checked (default), the same random number sequence is used for all strategies, so patients will take similar paths through similar strategies. When unchecked, strategies use different random number sequences, so patient pathways will immediately deviate among strategies. The default is off.
After the simulation is complete, you will be presented with the Monte Carlo Dashboard with the results from the simulation.
Microsimulation performs the following steps:
-
A single trial enters the model.
-
The trial is assigned values from the distributions.
-
A pathway is chosen through the model via a random walk.
-
When the trial completes its run, the final data for payoffs are stored.
-
Steps 1-5 are repeated for all subsequent trials.
-
The data is collected and aggregated into mean values to represent the Expected Values for each strategy.
-
Conclusions can be drawn from a comparison of the strategy EVs.
The Monte Carlo Dashboard provides a direct view into the underlying results as well as access to additional graphs and reports that help you interpret the results.
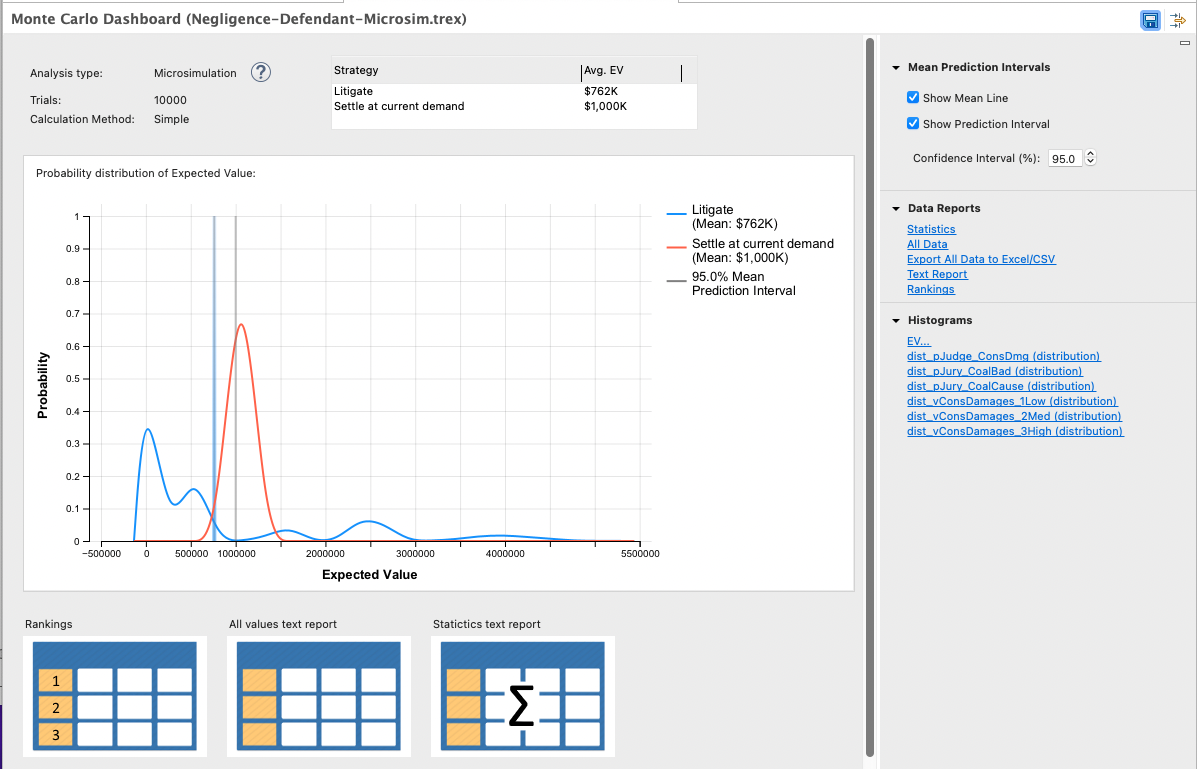
The Dashboard has the following information:
-
Analysis Information: This includes the analysis type, number of iterations (in this case trials) and model calculation method.
-
Summary of Results Table: This shows the average expected value for cost for each strategy. The vertical line indicates the mean value with the shading around it representing the prediction intervals around the means.
-
Quick links to commonly-used outputs: Click on the icon to open the associated graph or report (across the bottom).
-
Full list of data reports and graphs: To the right of the Dashboard is a full list of links to all reports. The individual reports are described below.
Data Reports
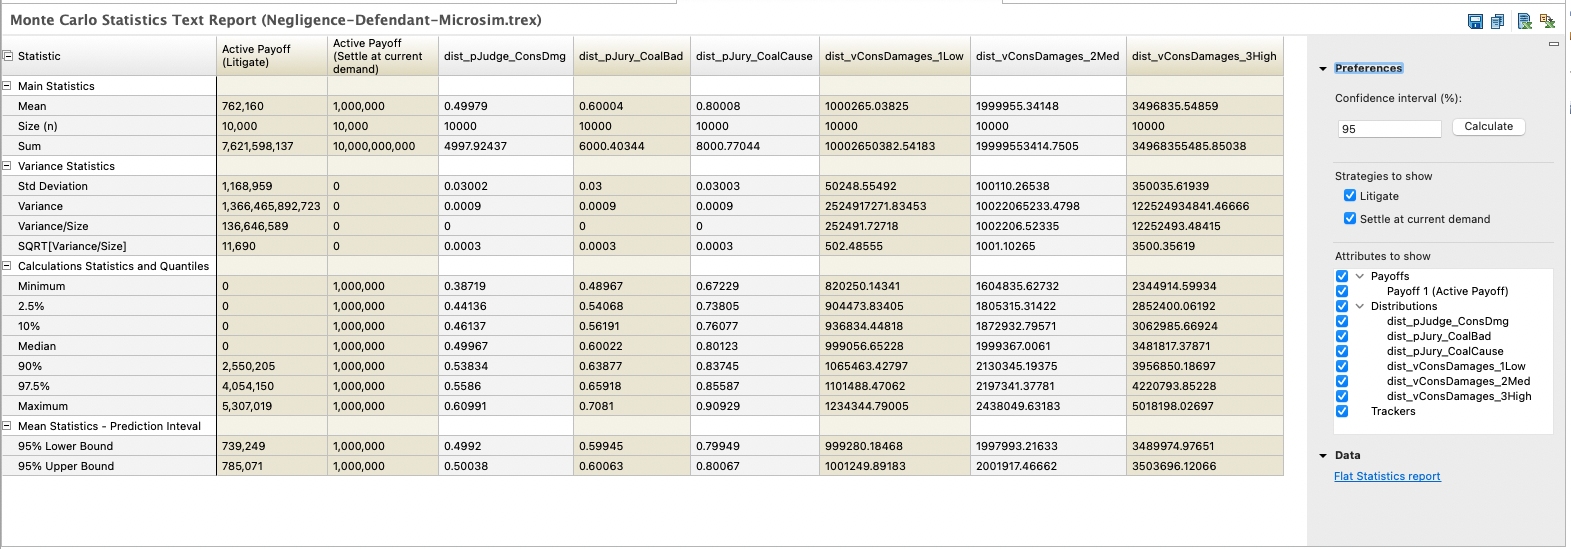
Statistics report provides the statistics for each payoff and distribution in the model. This report includes controls to the right to change the percentages for the Prediction Interval mean statistics and to hide/show different data values.
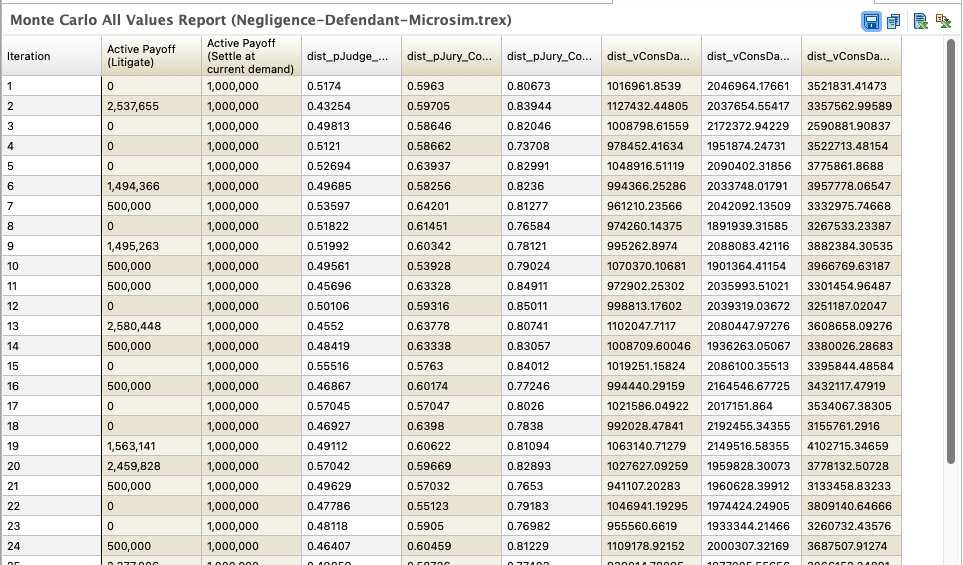
All Data report shows each iteration's (i.e. each trial's) payoffs and distribution values reported on a separate line. These are the individual values which are aggregated to give the Expected Value calculations.
The Export All Data to Excel/CSV link exports the same data from the All Data report to a CSV file easily opened in Excel.
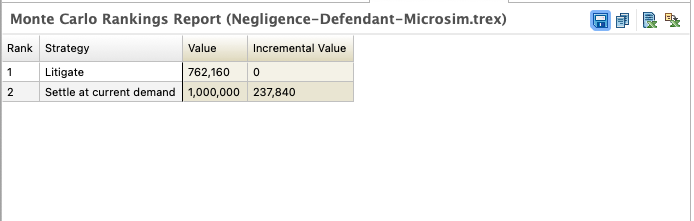
Rankings
Rankings shows the rankings report generated from the Expected Values from the microsimulation.
Histograms
Additional outputs like histograms are also available to see variance among model runs. These histograms are highlighted in the Probabilistic Sensitivity Analysis section. However, there is a significant difference between the histograms from microsimulation versus those from PSA.
-
Microsimulation - histograms are based on individual model runs, so significant variance is expected.
-
PSA - histograms are based on full model calculations, so less variance is expected.
To generate the Expected Value Histogram for each Strategy:
-
From the MC Dashboard, expand Histograms and then select EV...
-
From Choose Strategy, select the strategy of the histogram you want to see. Select Litigate, and then select OK.
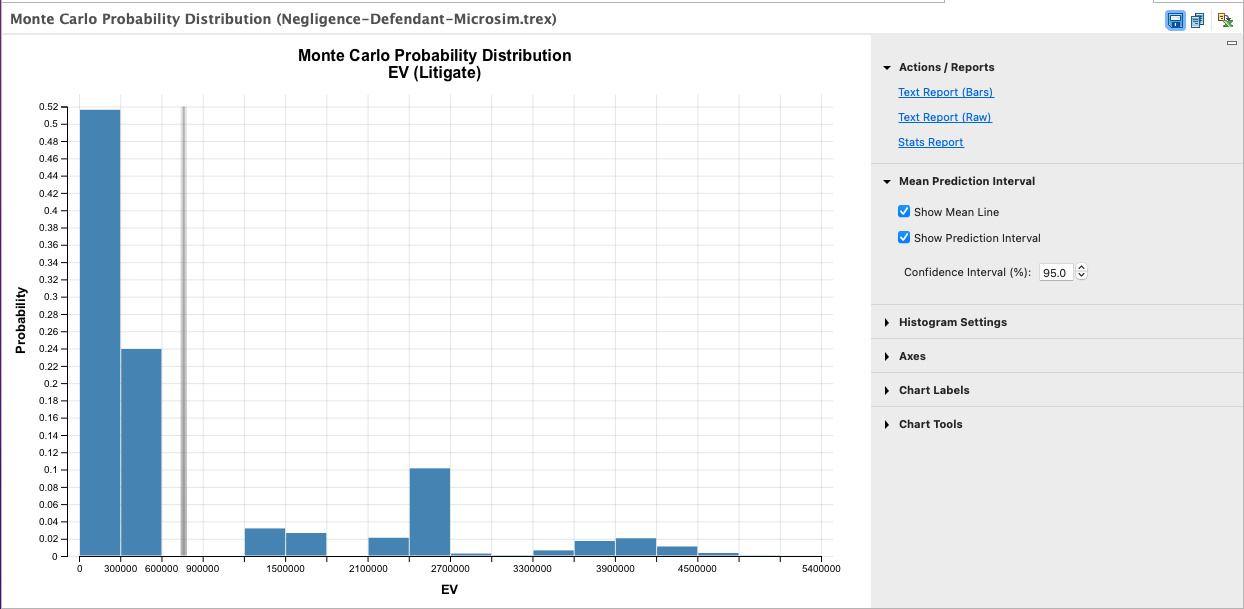
The histogram shows the range of outputs for the Litigate Strategy with the variance associated with the distributions we have entered into the model. Whilst the Mean line shows the value to be around 750,000 (actually 762,160 from the Stats Report) there is a high probability the value will be less than this and also greater than zero likelihood it could also be significantly larger than this too.