24.2 Outputs of One-Way Sensitivity Analysis
Following on from the previous section, we use the Legal tutorial example model, BreachOfContract-Variables.trex for analysis.
One-Way Rankings
The Actions > Rankings link and the Rankings Text Report button generate a text report with a series of rankings, one for each input value within the range for one-way sensitivity analysis.
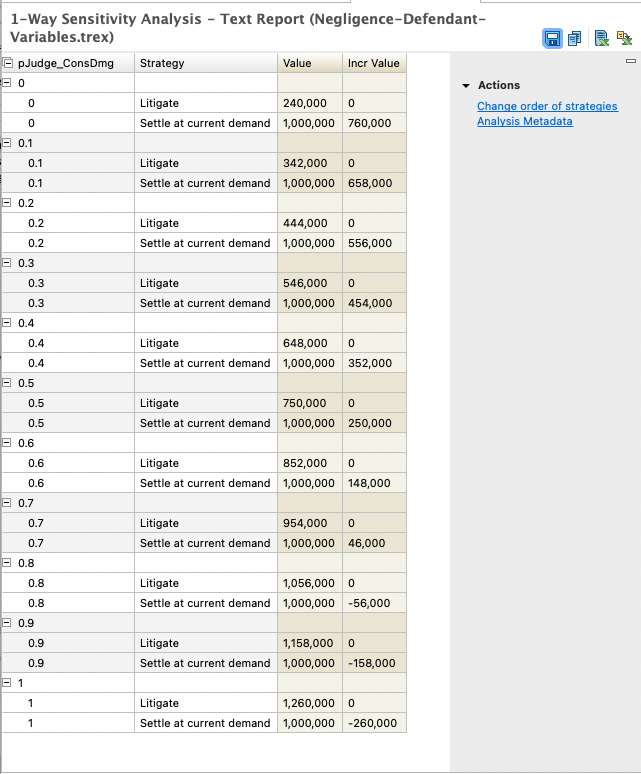
For each input value, you see the Rankings analysis from the model analysis. Note that for this specific input example, the results change for the Litigate strategy, but not for the Settle strategy.
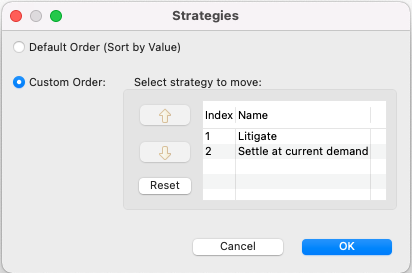
The strategies are sorted within each grouping based on a default ordering - Litigate and then Settle. You can choose to override the default sort via the option "Change order of strategies" to the right of the report. In this case where the cost of the strategies changes, we have chosen the option to maintain the order of strategies regardless of which was the least costly.
The text report (default or custom sort) can also be exported to Excel using the "Open in New Excel Spreadsheet" icon to the far right of the report toolbar. There are two export options - one showing each strategy in its own row and one showing all strategies in the same row.
If there were thresholds where one strategy's line crossed another, the Thresholds Report (link to right of graph) shows each threshold in the graph in a text format. Below is an example Thresholds Report for pJudge_ConsDmg over the range 0 to 1.0 to demonstrate thresholds which could occur.
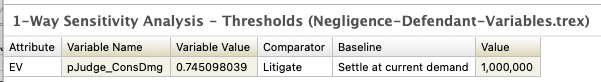
Thresholds are identified through linear interpolation. Thresholds can usually be identified more accurately by increasing the number of intervals in the original sensitivity analysis.
Several other sensitivity analysis graphs also have a supporting Thresholds Report. They all function in the same way - identifying the points where the maximum (or minimum for cost) value is represented by a change in strategy.
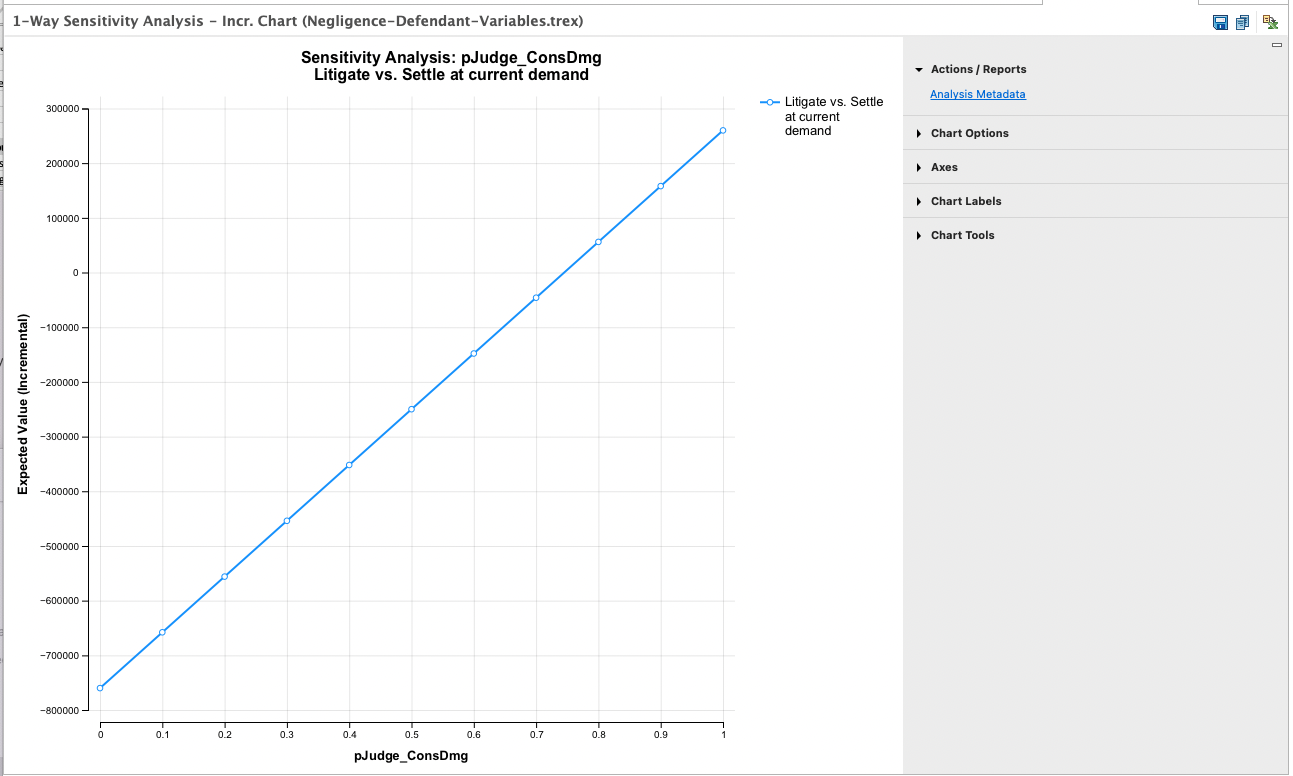
One-Way Value and Incremental Value Graphs
The sensitivity analysis Value and Incremental Value graphs allow you to focus specifically on costs within a model.
The cost graph can be run for all strategies or a single strategy.
The incremental cost graph can be run for any pair of strategies.