6.6 Analyze a Legal Model
We can now analyze the finished model built earlier in this section. While TreeAge Pro supports several types of analysis, two are used most frequently.
-
Roll Back / Expected Value of Case
-
Probability Distribution / Risk Assessment
Roll Back / Expected Value of Case
Roll back calculates the Expected Value of the case by considering the combined values and likelihoods of all pathway. Each pathway's value/outcome is weighted based on its likelihood - generating a weighted average of all possible outcomes. The image below shows the model when it is "rolled back".
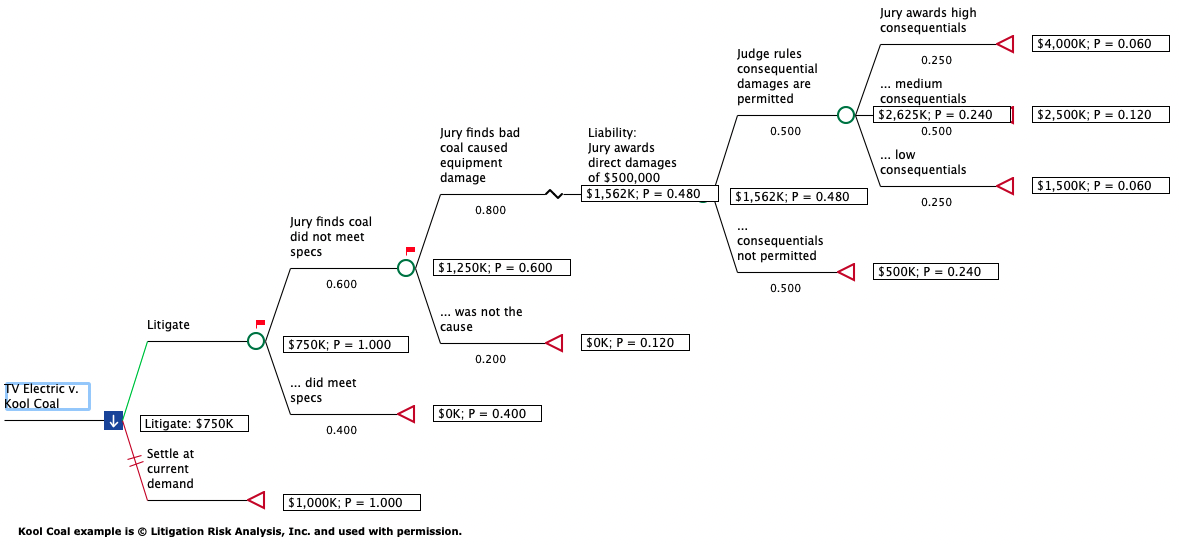
Note that the award value and likelihood are calculated for each terminal node endpoint. Then values are rolled up from right to left based on probabilities.
TreeAge Pro calculates the value of each strategy by weighing the value of each outcome based on how likely that outcome is to occur. For example, the top and least favorable outcome would result in a $4M award (outcome value), but that pathway is only 6% likely (probability/weighting of outcome). We have mapped out several possible outcomes for the Litigate strategy, and we need to consider all possible outcomes when calculating the overall Expected Value of the case.
Consider a simple example of a coin flip where you win $100 for heads and nothing if you lose. The value of that coin flip would be $50 - the weighted average of a 50% chance of winning the $100 and a 50% chance of winning nothing.
0.5 * $100 + 0.5 * $0 = $50
Decision trees, regardless of their complexity, work in a similar way. Below is a table showing the value, probability and weighted value of each terminal node/pathway in the Litigate strategy.
| End Node | Value | Probability | Weighted Value |
| Jury awards high consequentials | $4,000K | 0.06 | $240K |
| ... medium consequentials | $2,500K | 0.12 | $300K |
| ... low consequentials | $1,500K | 0.06 | $90K |
| ... consequentials not permitted | $500K | 0.24 | $150K |
| ... was not the cause | $0K | 0.12 | $0 |
| ... did meet specs | $0K | 0.40 | $0K |
| Sum | ----- | 1.00 | $750K |
Rolling back the model calculates the value of each strategy via this weighted average - resulting in an overall Expected Value of $750K for the Litigate strategy. The Settlement strategy has a single outcome of the $1M (the demand from TVU).
Another way to look at Roll Back results is from right to left. Consider the node Judge rules consequential damages are permitted. It has three branches that combine to determine the value of this node in a similar way as above, except that no probabilities to its left are considered.
| Branch | Value | Probability | Weighted Value |
| Jury awards high consequentials | $4,000K | 0.25 | $1,000K |
| ... medium consequentials | $2,500K | 0.50 | $1,250K |
| ... low consequentials | $1,500K | 0.25 | $375K |
| Sum | N/A | 1.00 | $2,625K |
So the value for node Judge rules consequential damages are permitted is $2,625K. This movement from right to left continues to the next upstream nodeLiability: Jury awards direct damages of $500,000 as seen below.
| Branch | Value | Probability | Weighted Value |
| Judge rules consequential damages are permitted | $2,625K | 0.50 | $1,312K |
| ... consequentials not permitted | $500K | 0.50 | $250K |
| Sum | N/A | 1.00 | $1,562K |
Continuing right to left to the Litigate strategy node, we get a value of $750K.
Representing the defendant, we would typically choose the strategy with the lower EV - Litigate at $750K over Settlement at $1M. While KC is not guaranteed to be better off going to court - it is more likely that KC will pay less in awards than it would by accepting the settlement offer.
Conclusions drawn from the model could prompt further settlement negotiations - perhaps agreeing to a figure closer to the Litigate strategy EV. However, let's assume that TVU will not agree to less than their original demand.
Probability Distribution / Risk Assessment
While it appears that KC should choose to go to court, there is risk of an outcome that far exceeds the settlement amount. The Probability distributions graph provides a graphical representation of this risk for consideration by KC.
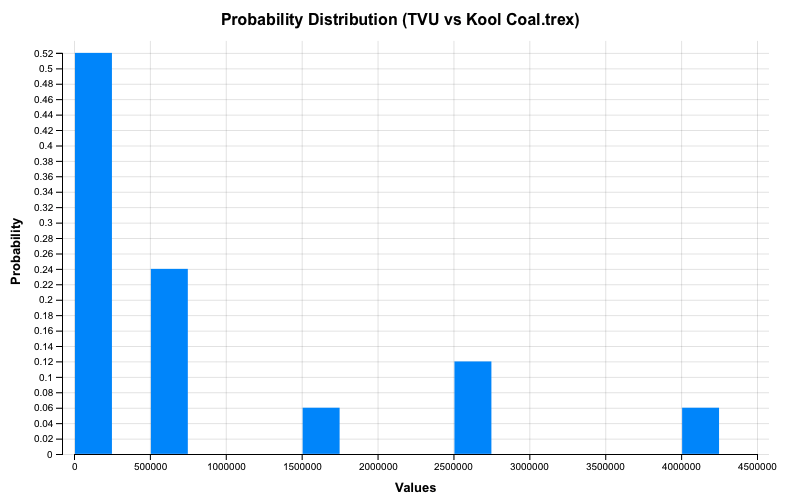
The graph above shows a range of potential awards along the x-axis, and the likelihood of those award values on the y-axis. This allows the client to assess risk of negative outcomes. The client might choose to settle for $1M to avoid possibly catastrophic awards of $2.5M or $5M. However, if KC can reasonably afford those worst-case scenarios, they would likely proceed with litigation based on the Litigate Expected Value being less than the $1M settlement demand.
Note that the probability distribution also shows the plaintiff's risk of litigation, indicating that it is more likely than not that KC will not be found liable at all. This could be helpful in negotiations.