8.9 Partitioned Survival Analysis
Partitioned Survival Analysis (PartSA) mirrors real disease progression by mapping the state of the model cohort directly from observed survival data. The selected outputs from a PartSA model describe state membership over time, and associated costs and utilities associated with those states.
The Analysis outputs are:
-
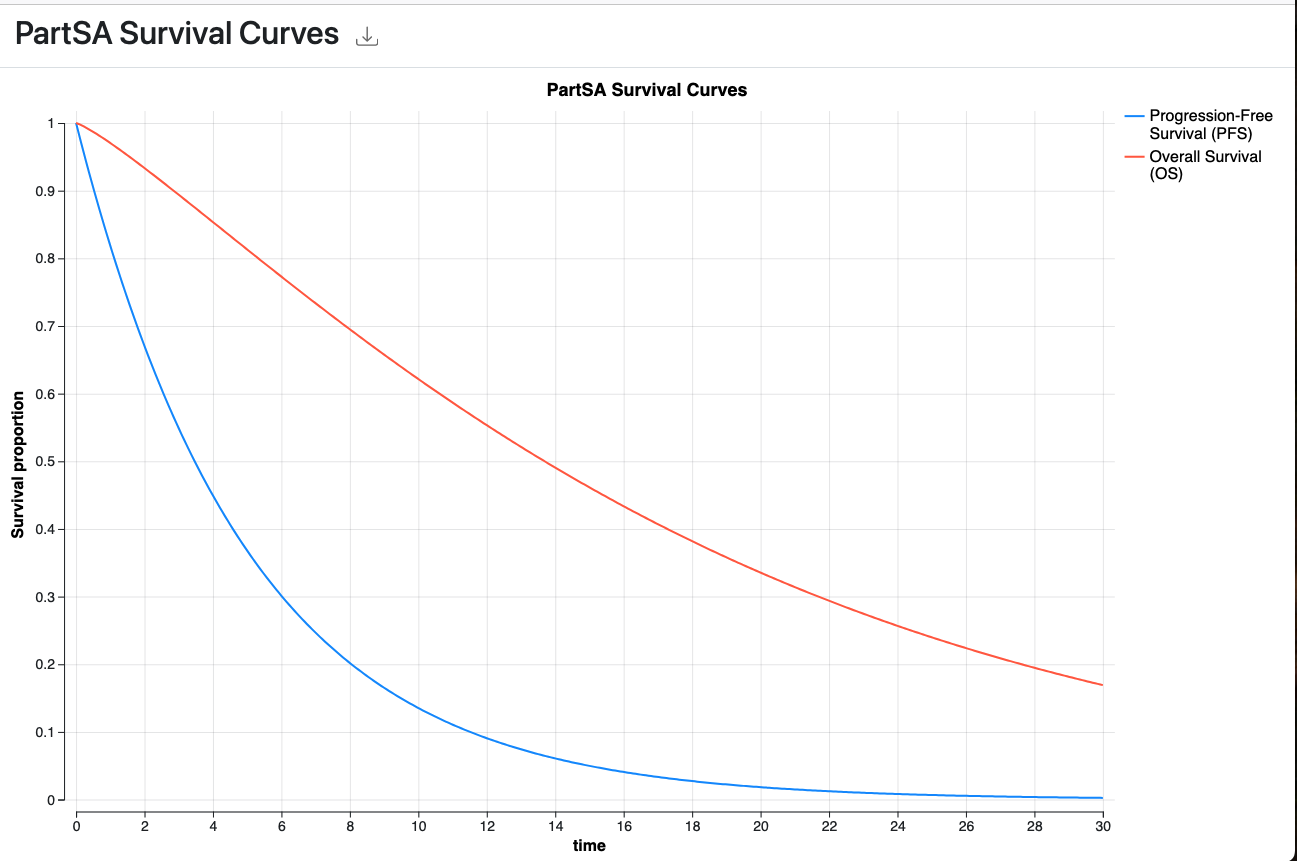
Survival Curve
-
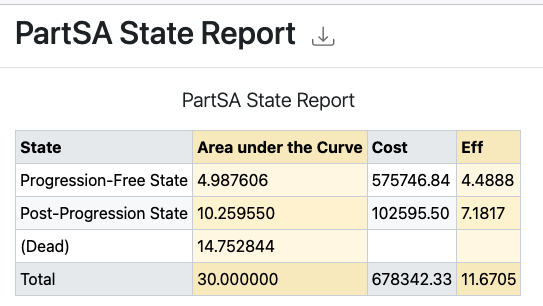
State Report
-
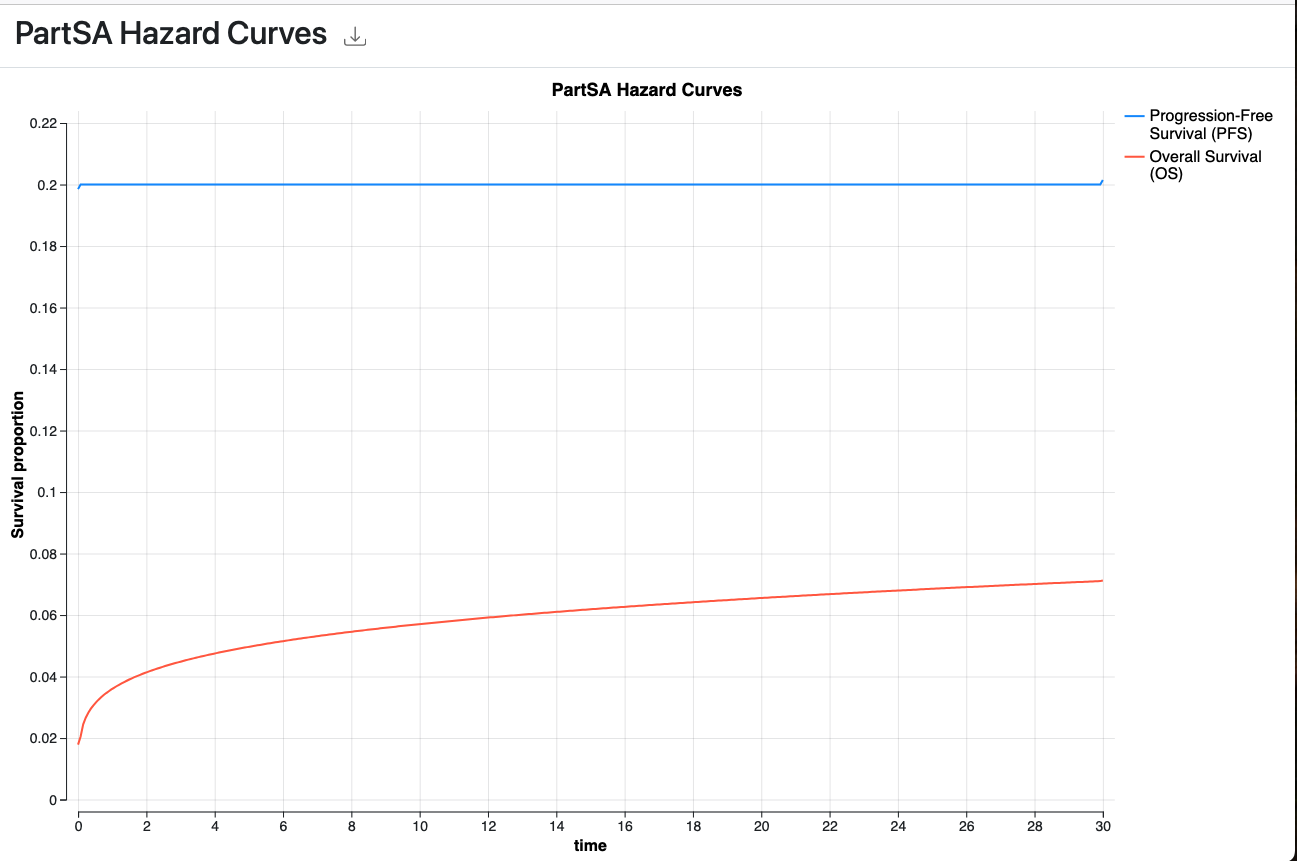
Hazard Curve
-
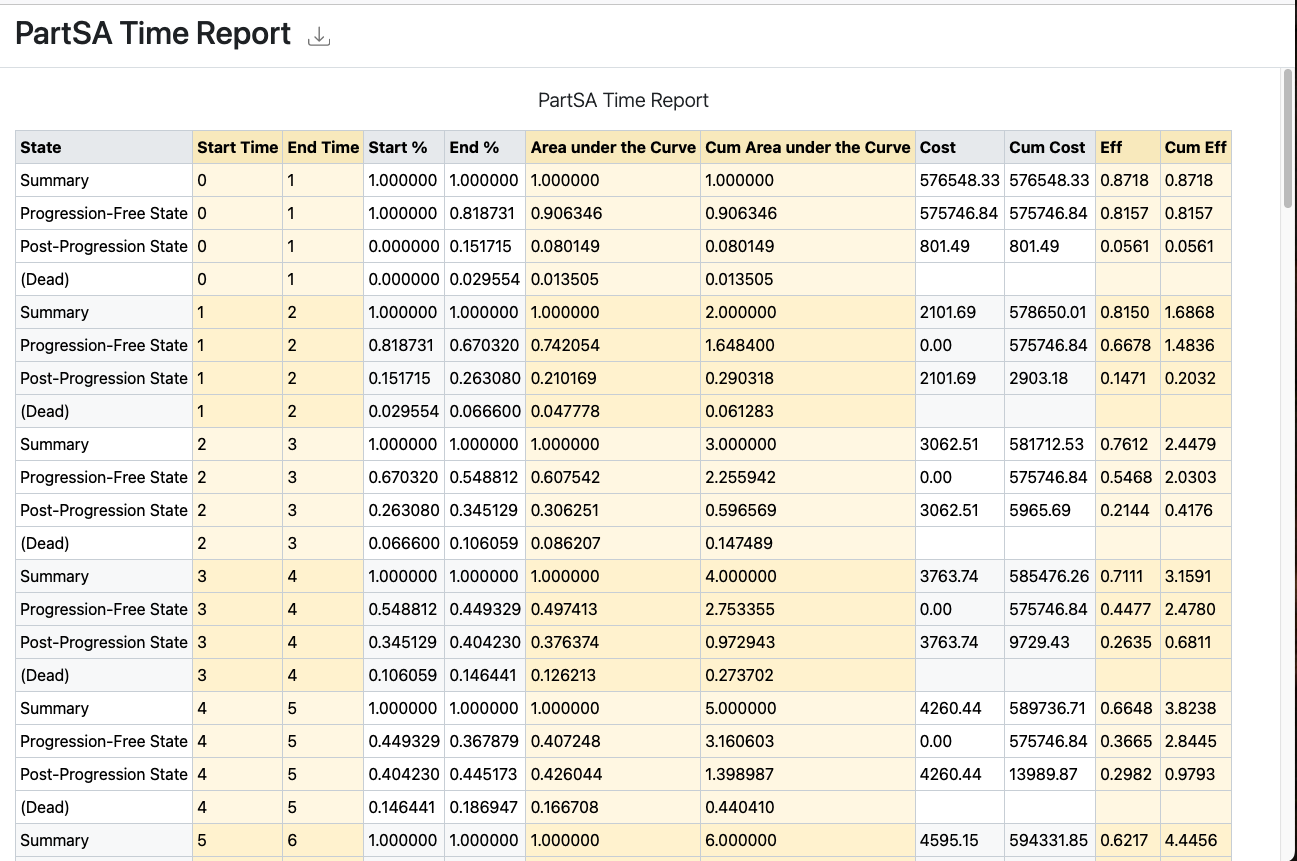
Time Report
The Survival Curve represents progression from one state to the next, state membership is represented as the areas above and below the survival curves. Below the blue PFS curve, the state is Progression Free. Between the blue and red curves, the state is Post Progression. And above the red curve is the implicit Dead state.
The Hazard Curve tracks the changing Hazard over time. In this case the PFS Hazard Curve shows a fixed hazard rate, as associated with an Exponential Survival curve. The OS Hazard Curve shows an increasing risk over time.
The State and Time Reports give different breakdowns on the same model analysis. The State Report gives the total area under each curve (time in state) as well as the rewards accumulated in each State, in this case Cost and Effectiveness. The Time Report splits continuous time up into discrete time steps and reports the proportion of the Cohort in different health states (according to the model). It allows the modeler to check the proportion of the cohort and the rewards accumulated in each state over time.