8.8 Patient Level Simulation - Microsimulation
Microsimulation output shows selected outputs from a Microsimulation/Patient Simulation Model.
The Microsim C-E Chart and Rankings generate cost-effectiveness output based on the mean values from the full set of simulated patients. These graphs and reports use the same format as the Rankings and C-E Charts for non-simulation models which you can review in the previous sections.
In addition, Microsimulation generates probability distribution trend line graphs for metrics generated from the output of Patient Level Simulation. These show variance among individuals within the overall patient cohort.
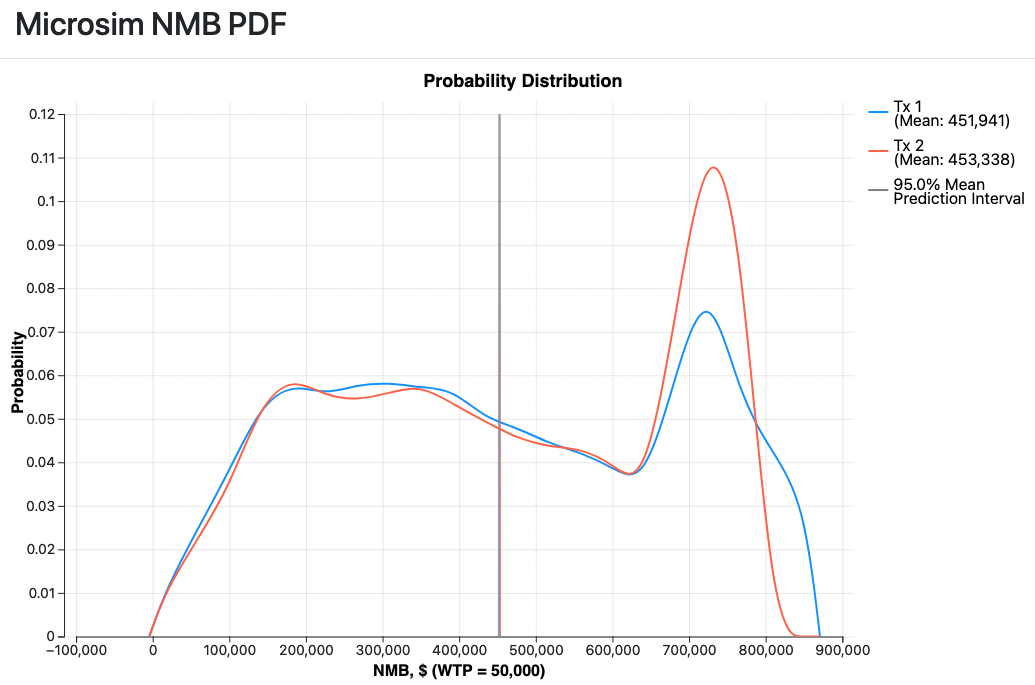
The Microsim NMB PDF generates a probability distribution trend line for each strategy showing the Net Monetary Benefit (NMB) mean and variance among trial runs.
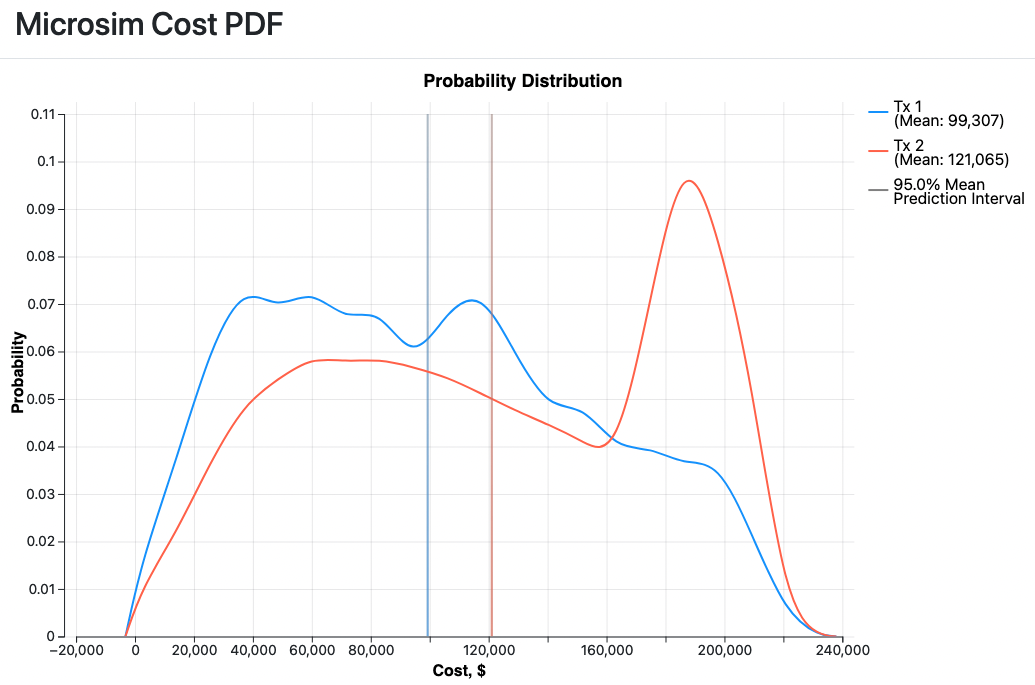
The Microsim Cost PDF generates a probability distribution trend line for each strategy showing the Cost mean and variance among trial runs.
The Microsim Eff PDF generates a probability distribution trend line for each strategy showing the Effectiveness mean and variance among trial runs. It looks similar to the two graphs above.
You can also generate a report of overall statistics for the simulation analysis.