8.9 Probabilistic Sensitivity Analysis
Probabilistic Sensitivity Analysis (PSA) shows selected outputs from a model where uncertainty has been run using PSA.
The Analysis outputs are:
-
CE Scatter Plot
-
ICE Scatter Plot
-
Acceptability at WTP
-
Acceptability Curve
The CE Scatter Plot uses the cost-effectiveness plane to plot the individual cost and effectiveness pairs for each recalculation of the model. If the simulation is performed at a decision node, each strategy’s set of points uses a different color.
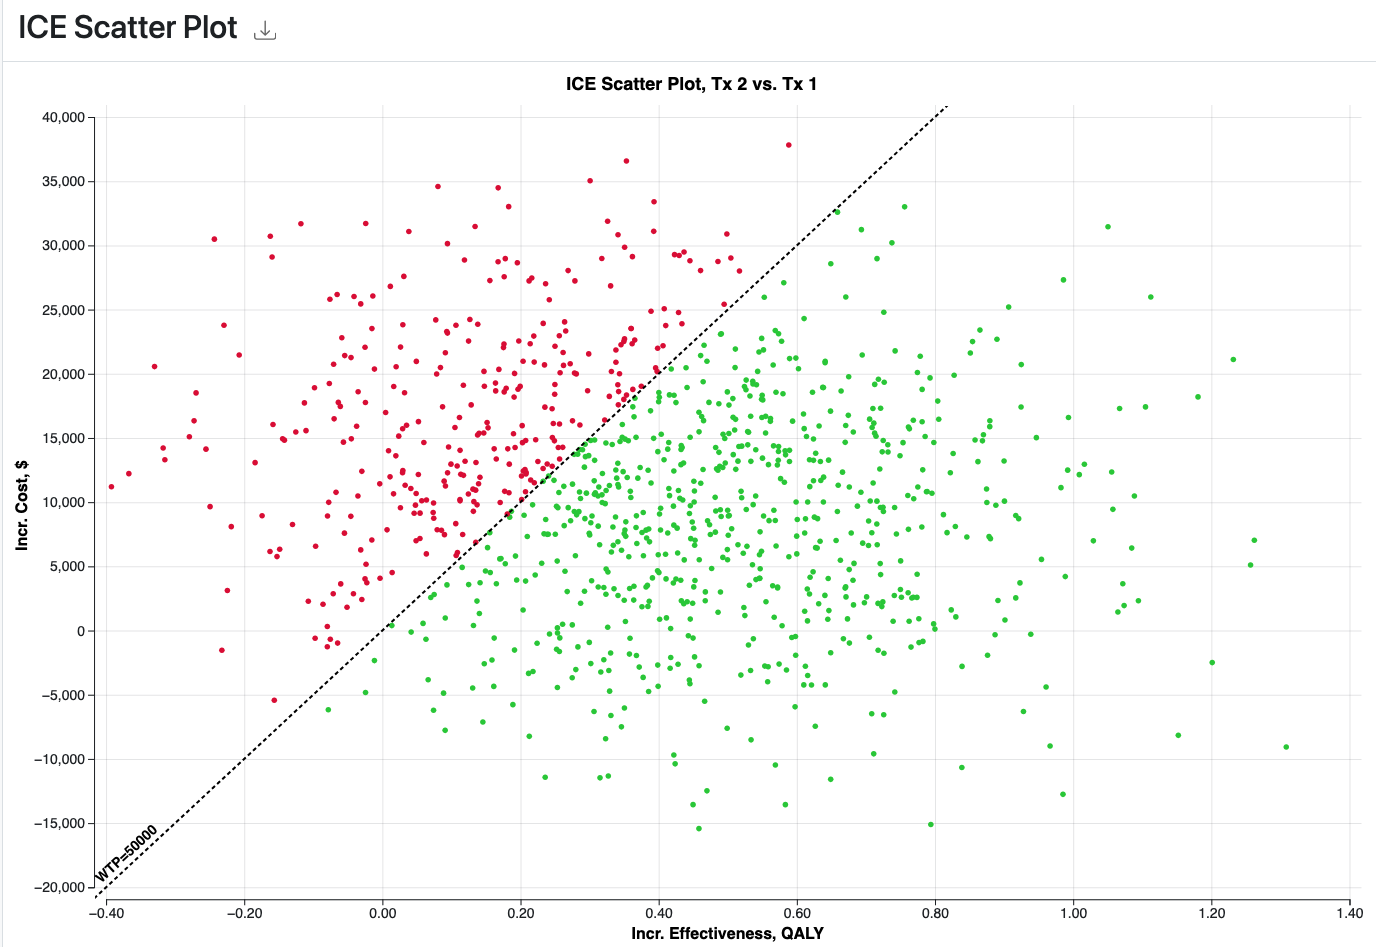
The ICE Scatter examines the incremental cost and incremental effectiveness between any pair of strategies - as chosen by the modeller. Those incremental values are then plotted for every model calculation for the two strategies - in this case Tx 2 versus Tx 1. .
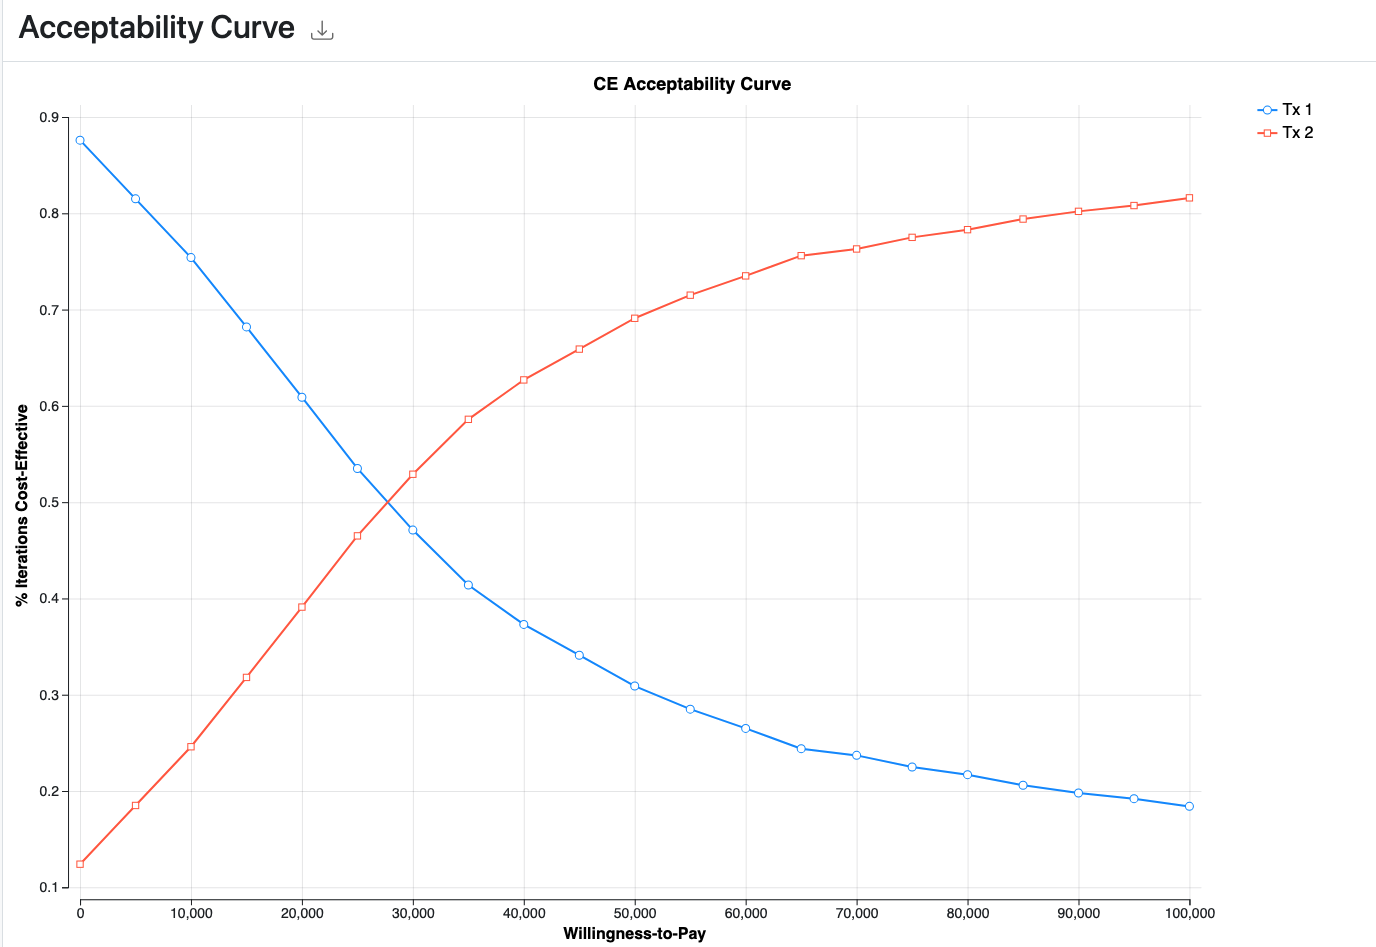
Acceptability at WTP shows the percentage of iterations that favor each strategy based on net benefits calculations at a specific willingness to pay value (rather than a range).
Acceptability Curve is a commonly-used visual aid for communicating the results of probabilistic sensitivity analysis in cost-effectiveness models. It presents the percentage of model calculations that favor each strategy across a WTP range. For each WTP value, NMB is calculated for each strategy, and the percentage of calculations where each strategy has the highest NMB is presented in the graph. As WTP increases, the percentages will increase for more effective strategies.