51.3 Tunnels in Markov Excel models
If a Markov Model uses Tunnels, as opposed to a Traditional Markov model (with or without Half Cycle Correction),then the Strategy Results and the State Details sheets will include additional data.
The Health Care Tutorial Example model Markov Conversion Model Tunnel.trex already has Tunnels enabled for the Metastases state (state 2) with Tunnel Max set to 2 via the Markov View.
The Tunnel impacts the variable pMetastasesToDead, changing the probability of Death from Metastases dependent on how long the cohort has been in the Metastases State. See the definition of pMetastasesToDead in the Variables View.
In the State Details sheet for a tunnel state, the first few columns will display the overall summary for the health state, followed by the individual tunnel states within the overall health state. The values from the tunnel states will always sum up to the values for the overall health state.
The figure below shows State details for the overall Metastases State along with the Tunnel State highlighted as Tunnel State 1, while Tunnel State 2 is out of the picture to the right.
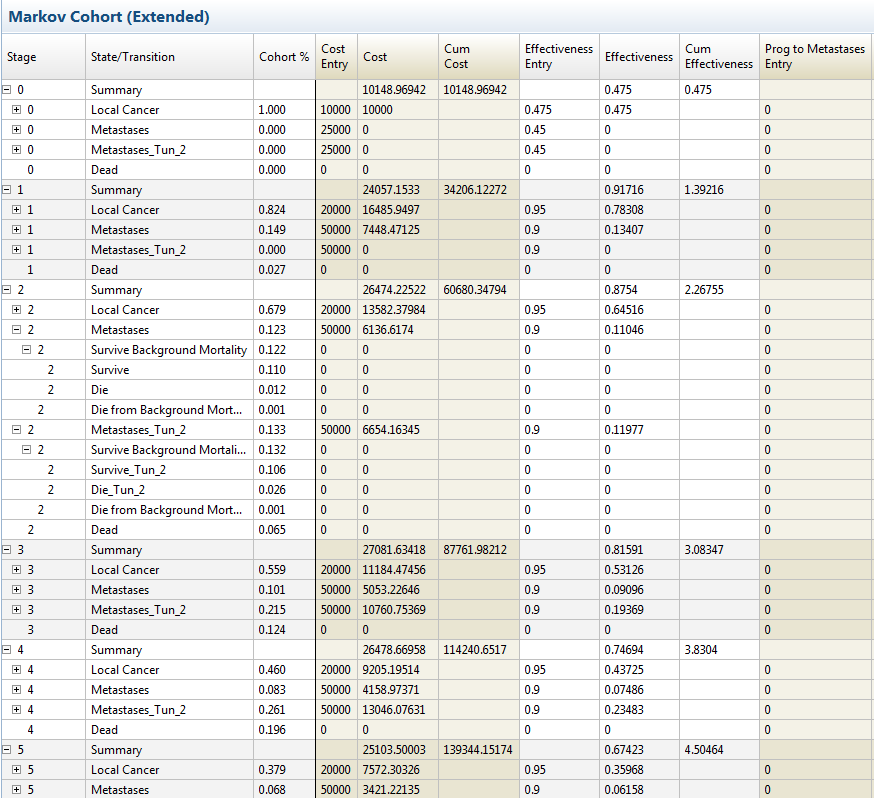
The details can be validated back to the Markov Cohort Extended Report, where the Tunnel States are explicitly detailed. Note that the in _stage 2, the overall cost for the Metastases state is 12790.78, which is the sum of the cost from Metastases Tunnel State 1 and Metastases Tunnel State 2 (6136.62 + 6654.16).
If the model was converted with the Single Sheet per Strategy, then the format of the Strategy Results would include the additional columns for the Tunnel States as displayed in the State Details figure above.
