6.1 Building Markov Models
While most decision trees include a simple notion of time (i.e., left to right chronologically), there are no shortcuts in a standard tree structure for representing events that recur over time. A state transition model, also called a Markov model, is designed to do just this. Markov models are used to simulate both short-term processes (e.g., development of a tumor) and long-term processes (e.g., an individual’s lifespan).
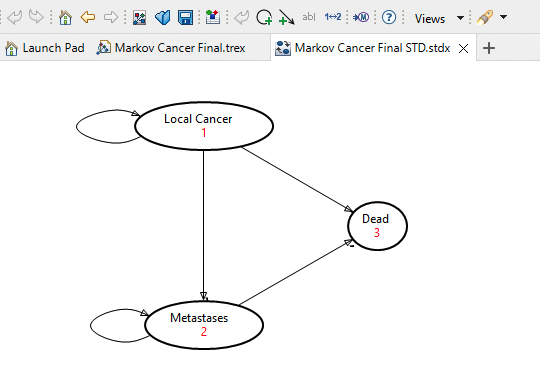
In a State Transition Diagram (see below), where each state is represented using an oval, arrows represent transitions. In TreeAge Pro you can create State Transitions diagrams but they cannot be used for any analysis. You can convert the State Transition Diagram (STD) to a Markov Model and add model inputs before analyzing the model.
TreeAge Pro represents Markov models in a decision tree format, which is more easily integrated into decision trees. Markov models can be appended to paths in a TreeAge Pro decision tree anywhere you might place a terminal node. The Health Care tutorial example tree Markov Cancer Final.trex is presented below. We will build this Cost Effectiveness Markov model in the subsequent sections.
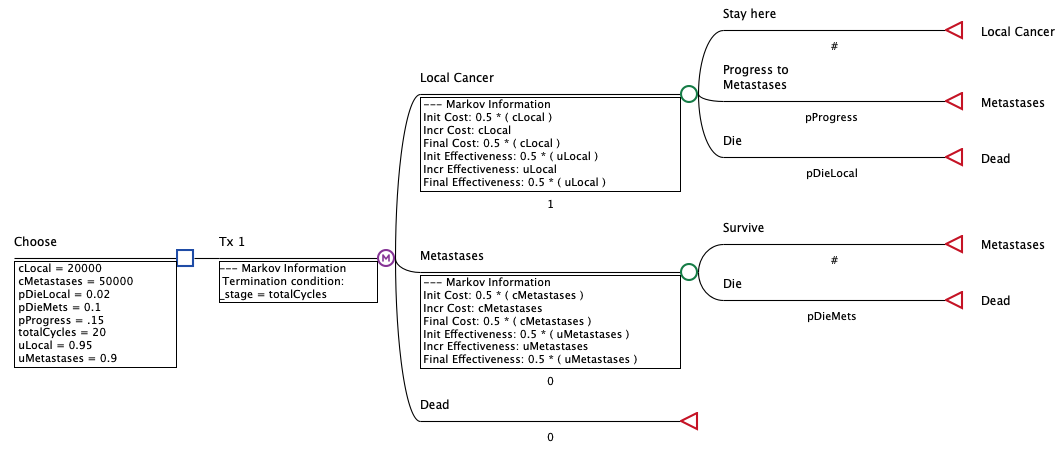
The design of a basic Markov model requires consideration of several components. These are:
-
Markov NodeStarts the Markov process and defines how long it will run.
-
Health States: The set of distinct health states which describe the current health status of a patient. The cohort is split amongst the health states at the beginning of each cycle.
-
Events/Transition Subtrees: The model structure to the right of each health state that define the events a patient could experience after starting a cycle in that health state. Dead (absorbing) states will have no transition subtree.
-
Cycle length: The length of time represented by a single cycle (or stage) in a Markov model. This value is implicit but must be consistent in all probabilities, all rewards, and the termination condition.
-
Initial probabilities: A set of probabilities describing the initial distribution of the cohort among the states. These are used only before the first cycle. For all other cycles, the proportion of the cohort in each state will be dependent on the transition subtrees.
-
Event/transition probabilities: The probabilities for all events in the transition subtrees including, but not limited to, transitions between states.
-
Values/Rewards: Per-cycle costs and/or utilities for each outcome measure being calculated (e.g., costs, QALYs). Rewards may be associated with any health states and with any events in the model.
-
Termination condition: A logical test evaluated at the beginning of each new cycle to determine if the process should continue or stop.
Further details:
-
Follow this link for more details about how to build State Transition Diagrams in TreeAge Pro.
-
Please look in the section Appendix: Calculation Basics of Markov Models for more details about calculating Markov Models and about Non-standard Markov Models.
