22.6 Standard deviation
In addition to comparing strategies based on their expected values, TreeAge Pro also offers several ways to look at an option’s risk — the degree of variability in outcomes. The basic statistical measure of risk is standard deviation. In TreeAge Pro, a standard deviation can be calculated for a single strategy (or any other chance node), based on the path probabilities and payoffs of all terminal nodes in its path.
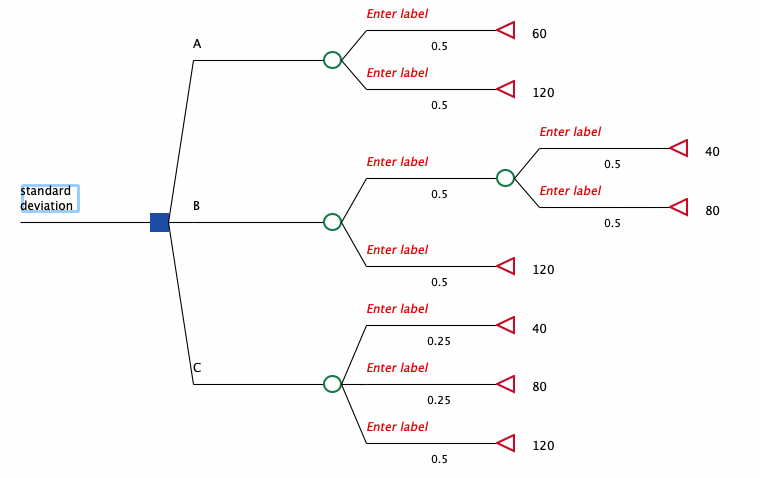
To try the standard deviation calculation, try the Special Features tutorial example, Standard Deviation.trex. In this tree, despite the fact that the three alternatives look different, a rankings or roll back analysis is indifferent between them — all three have the same expected value: 90. In this case, a choice might be based on minimizing risk as measured by standard deviation.
-
To calculate a standard deviation:
-
Select the chance node labeled A.
-
Choose Analysis > Standard Deviation.
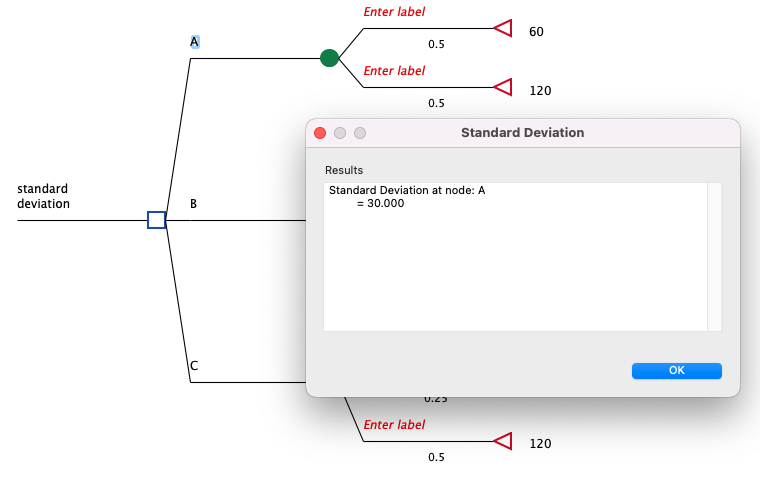
The calculation used is:

where 90 is the strategy A’s expected value, or mean. Compare this to the calculated standard deviations for strategies B and C:
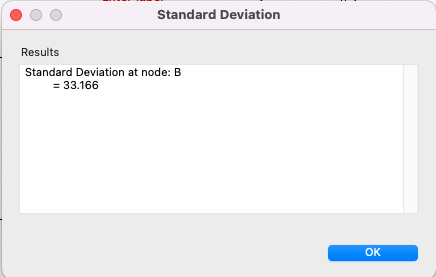
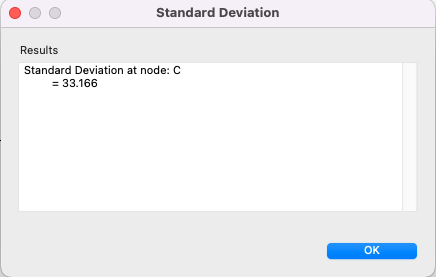
If you were to choose a strategy based on minimizing risk, as measured by standard deviation, strategy A would be preferred. Note that B and C are statistically identical, having the same terminal node values and path probabilities, and thus the same standard deviation:

