23.2 Are My Simulation Means Stable?
All simulations include many elements of randomness, so multiple identical runs will generate different results (assuming seeding is off). Given this "noise" among model runs, how do we know if a single run has generated results that are stable enough to draw robust conclusions.
We will start by examine the robustness of results of Patient Simulation described in section Running Microsimulation and Interpreting the Results. That analysis ran 10K patients through a healthcare model and the mean values from each strategy are used to draw conclusions.
How do we know that 10K patients is enough to generate robust results?
We know that running more patients will generate more stabilize means, but how many patients do we need?
TreeAge Pro provides two mechanisms to assess the convergence of results to stable means.
-
Prediction intervals around mean values that provide a range for how far the mean could realistically be off.
We will examine these values within this section. -
Simulation batch analysis to allow repeated running of the same analysis to see how much mean values vary.
This is described in section Batch Simulation.
The next section Standard Error and Prediction Intervals introduces some of the mathematical concepts behind these concepts and calculations. Then we will return to this patient simulation example.
Returning to the simulation from section Running Microsimulation and Interpreting the Results. The dashboard below presents an overview of the simulation results.
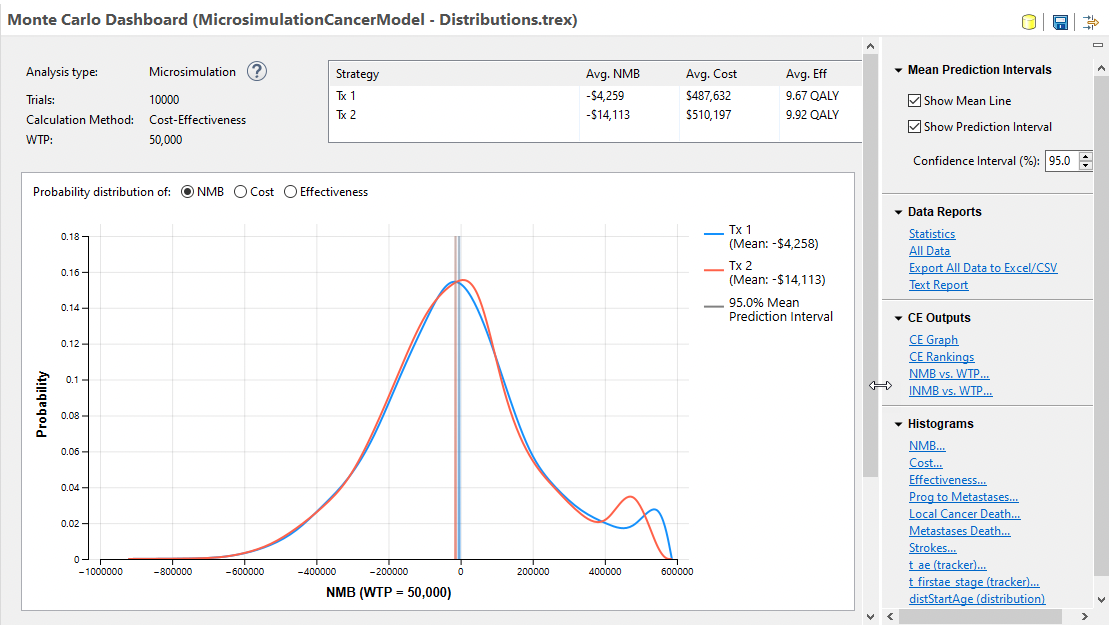
The probability distribution trendline for each strategy describes the mean and variance among model calculations. The graph default uses NMB, but tabs are available to switch to Cost or Effectiveness. The vertical lines and shading represent the mean values and the prediction interval around those means. Note that the mean values are close, but the prediction intervals do not overlap.
The Statistics Report provides the prediction interval ranges.
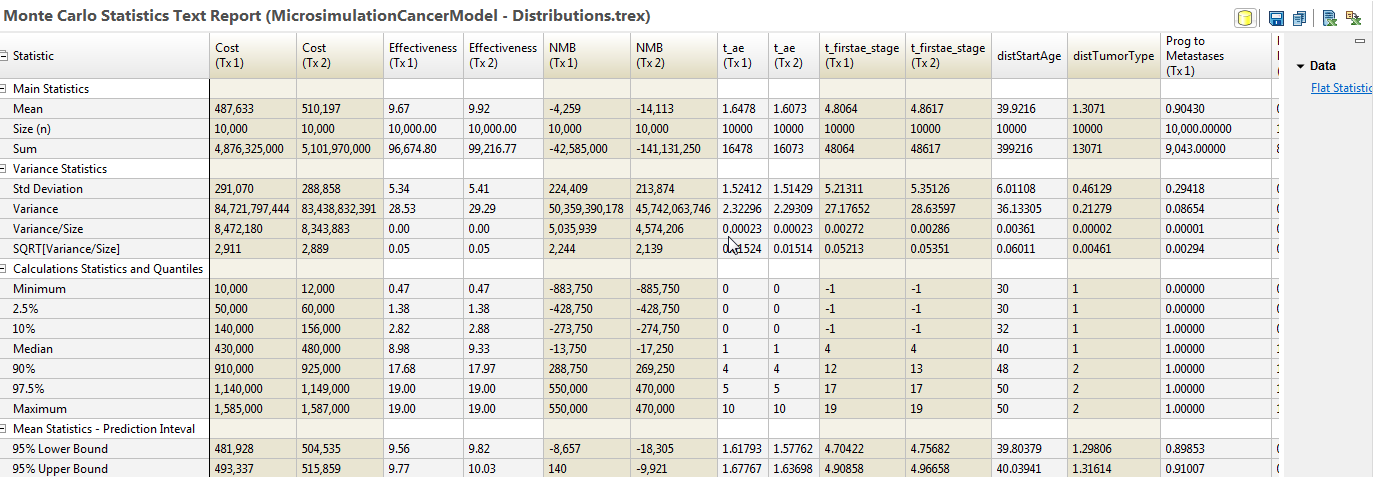
Note that the NMB prediction intervals do not overlap, but they are quite close. A reasonable argument could be made that additional iterations (simulated patients) should be run to make the NMB prediction intervals more distinct.
If you run a batch of 10 simulations of 10K patients and another batch of 10 simulations of 20K patients, you will see the that the means are more stable and the prediction intervals narrow as you add patients to the simulation.
