39.5 Filtering Results (Subgroups)
When running microsimulation you may be interested in analysing only a subgroup of the whole population. TreeAge Pro allows microsimulation output to be filtered and/or refactored in the following ways.
-
Filter the output to include only iterations that meet selection criteria.
-
Change the active payoffs.
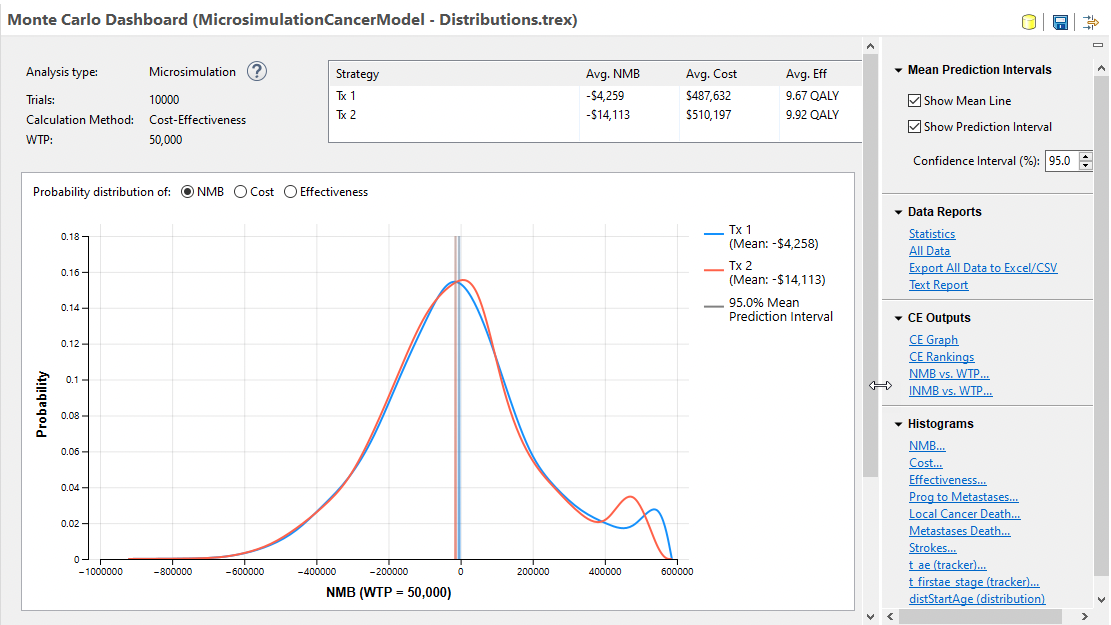
Consider the Health Care tutorial example model, MicrosimulationCancerModel - Distributions.trex. When you run a Microsimulation analysis on the model, all patient characteristics and outcomes within the dataset are presented as Microsimulation results, as detailed in the section above.
From the output above, the following CE Rankings report was generated.
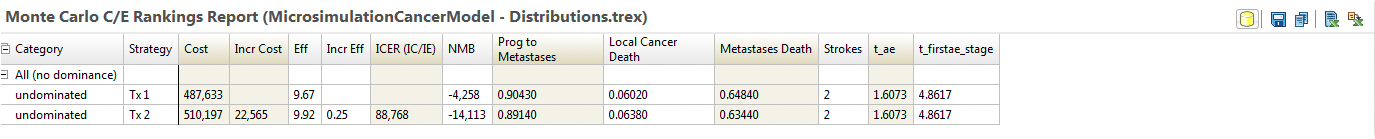
In the model, one of the individual characteristics is tumor type, which has either the value "1 = less aggressive" or "2 = more aggessive". We can choose to filter the results by tumor type to see if there is a change in results (and possibly the optimal strategy) dependent on tumor type. Simulation filtering provides the basis for the analysis. In the primary Monte Carlo Simulation CE Statistics analysis output window, click the filter icon to start filtering the results.

To filter microsimulation results:
-
To filter for the more aggressive tumor type.
-
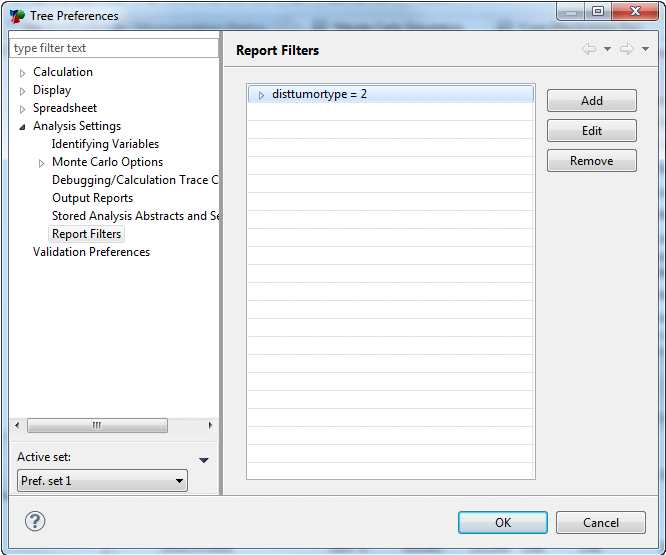
Select the filter icon at the top-right of the Monte Carlo Simulation CE Statistics and the Perferences for the filter will open.
-
To create a filter select "Add" and use the Report filter editor to define the expression. In this case the expression is distTumorType = 2. Then, select OK to close the editor.
-
In the preferences dialgoue there will now be one filter which has automatically been set as Active. We can select Apply and then examine the filter results.
-
Note that to make any filter unactive, we select that filter and use the button on the RHS to Unset Active.
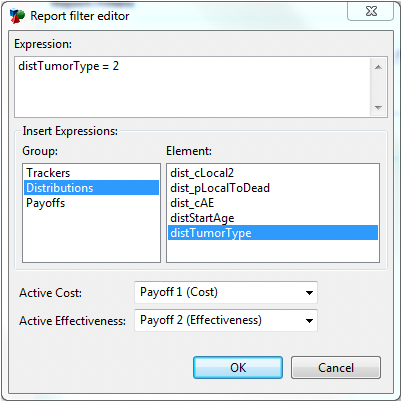
The Report Filter Editor provides the option to filter results based on any input characteristic (distributions) or output data (payoffs, trackers).
When filters use output data, strategies will not have the same results for each simulation iterations. If you apply a filter to output data, the row will remain in the filtered data set, if the interation row meets the filter criteria for any of the strategies.
The Report Filter Editor also allows you to change the Active Payoffs for the model's calculation method. If you had multiple valuations of cost and/or effectiveness, you could change the active payoffs through this editor to re-evaluate the model (CE analysis) using different model outcomes.
To filter for more than one characteristic or attribute, you can combine filters using "and" and "or". For example, the filter "distTumorType = 2 and age > 40" would filter for all trials with a severe tumor type and with an age above 40. You can use the relational operator "or" in an expression like "distTumorType = 2 or age > 40" to include iterations where either of the two conditions is true. You can also use parentheses to control multiple conditions like "(condition x and condition y) or condition z".
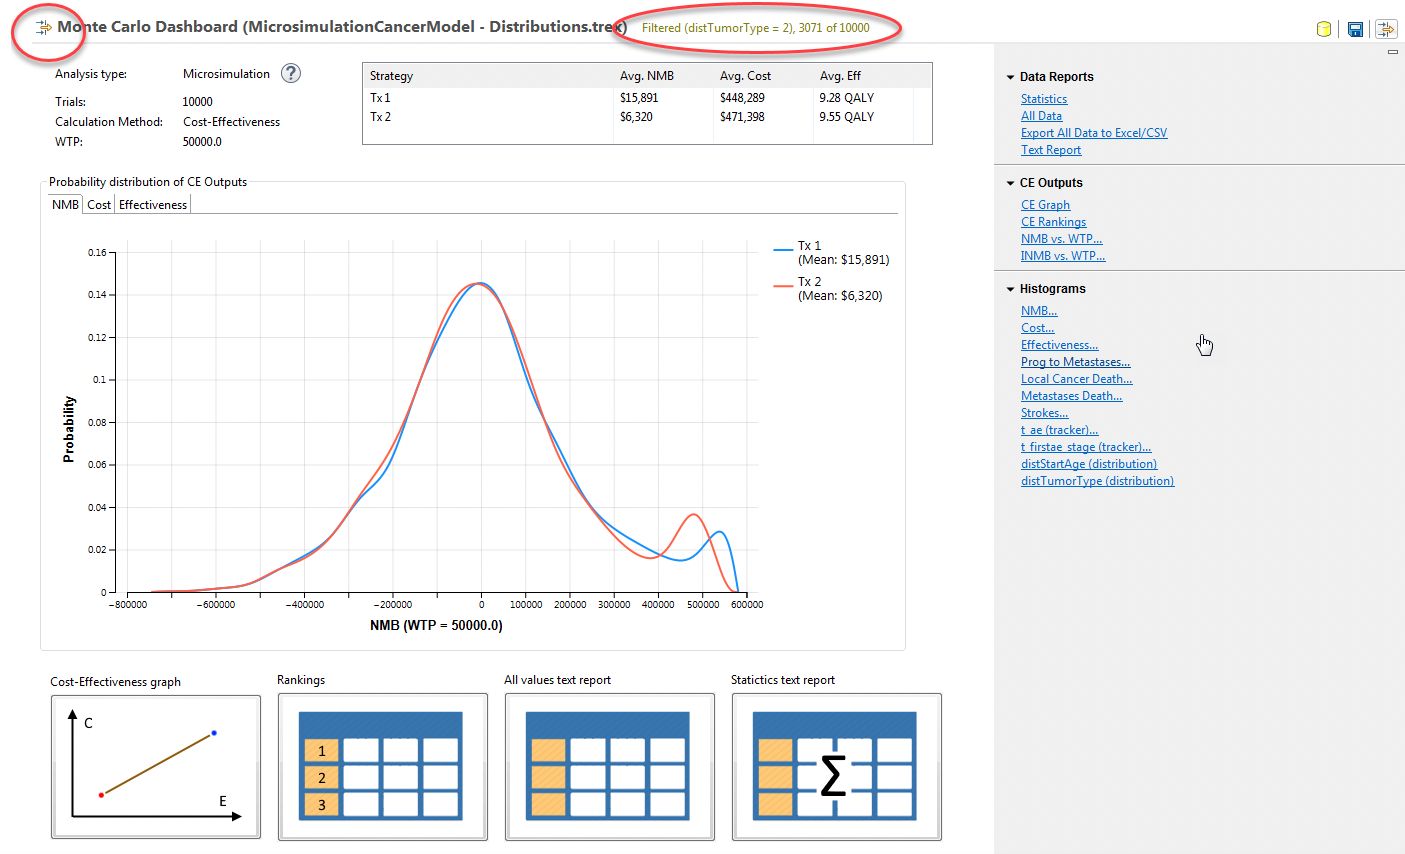
In the distTumorType = 2 filter, the total number of iterations has been reduced from 10,000 to 3,071, reflecting the iterations with trials with tumor type 2. All secondary outputs, including the CE Rankings report below will now be generated from the filtered set of results.
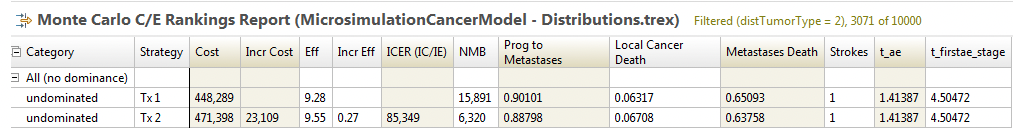
In the filtered results for the more aggressive tumor, the overall for each strategy is about 0.5 QALYs less. And the ICER increases by around $3000, so the strategy selections would likely be the same. This may not always be the case.
When a filter is created for simulation output, the new filter is automatically copied back into the Tree Preferences for the model, so it can be reused for future analyses, as below.