39.6 Debugging Simulations, the Calculation Trace Console
TreeAge Pro has several tools to assist with debugging models. The Calculation Trace Console can be used to display/report a variety of textual information to help debug a model, including: error messages, text-only analysis output, stored analysis summaries, and detailed internal calculations (e.g., step-by-step evaluation of variables). This section will describe these tools.
The section Model Debugging and Validation Tools also has detailed information about model debugging for all model types.
To turn on output of the Calculation Trace:
-
Choose Tree > Tree Preferences from the menu or press F11.
-
Navigate to the Tree Preferences category Analysis Settings > Debugging/Calculation Trace Console.
-
The Tree Preferences dialogue gives many options to debug your model.
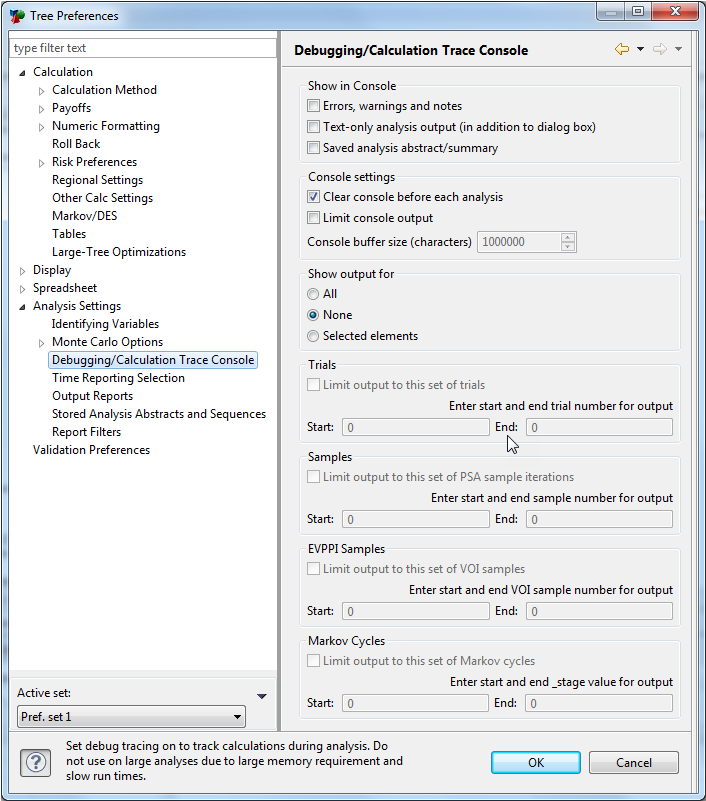
Show Output for: All
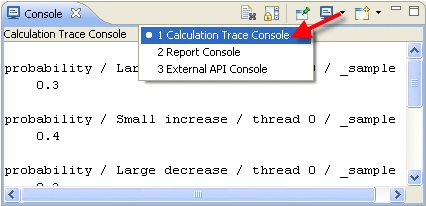
This option gives you the option of sending to the Calculation Trace Console: each variable, probability, and calculation in detail in the Calculation Trace Console View. The Calculation Trace Console View can be found in the Console View, as shown in the figure below.
Turning on Internal Calculations can significantly slow the analysis. There are additional, more refined options which will still allow you to examine specific calculations without displaying every single external calculation.
Use Debug output for Selected Elements
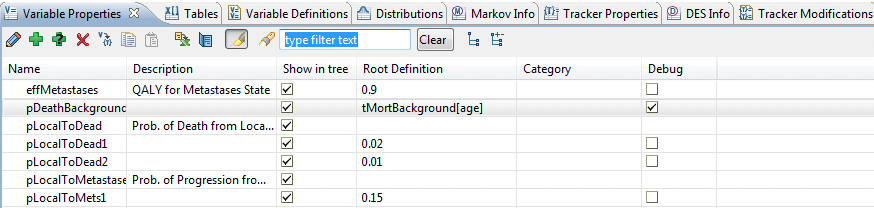
This is the most effective way to debug specific elements of your model. This feature, added in 2018 R1.0, allows you to select Variables, Trackers and Distributions to debug by selecting them from the appropriate View (Variables, Variable Definitions, Tracker Modifications and Distributions).
The figure below shows selecting specific variables in a model to debug. More details about this can be found in the section Model Debugging and Validation Tools.
Using the Debug() function
The Debug() function can be used to control/limit debugging output during simulations, or to add custom text to the pane. This may be of interest when an internal calculation debugging output may be millions of lines per analysis. Use the Debug() function to dynamically turn on and off the flow of calculation outputs to the Calculation Trace Console at strategic points in the analysis.
Refer to the Model Debugging and Validation Tools section for details on how to use these tools in your models. The Controlling Layout, Formatting and Display of Trees section provides details on the Debug() function syntax.
Using the GlobalN() function
Another more customizable approach to debugging complex simulations involves the Global matrices. The GlobalN() and Global() functions can be used in a variety of ways, and are capable of storing millions of user-specified values and calculation results during simulations and other analyses.
The section on parallel trials and dynamic microsimulation later in this chapter provide additional discussion about using the GlobalN function for reporting. For more details, refer to the Controlling Layout, Formatting and Display of Trees section.
