41.2 Probabilistic Sensitivity Analysis and Microsimulation
The probabilistic sensitivity analysis method samples sets of parameter values and, for each set, recalculates the expected values for the model. The Probabilistic Sensitivity Analysis on CE Models section covers PSA for cohort models. The outputs are all the same for PSA on patient simulation models.
The theoretical background for this kind of probabilistic sensitivity analysis is discussed in detail elsewhere, for example, in papers published in the Journal of the Society for Medical Decision Making including:
“Monte Carlo Probabilistic Sensitivity Analysis for Patient Level Simulation Models,” Anthony O'Hagan, et al, Health Economics, 16:1009–1023 (2007).
“Representing First- and Second-order Uncertainties by Monte Carlo Simulation for Groups of Patients,” Elkan Halpern, Milton Weinstein, Maria Hunink, G Scott Gazelle, Med Decision Making 20:314-322 (2000).
You are urged to explore these and other publications on this topic.
Performing Sensitivity Analysis with Microsimulation
Consider the Health Care tutorial example model, MicrosimulationCancerModel - Distributions.trex.
To generate meaningful results with PSA, we need to have distributions which represent the uncertainty we want to examine around certain model parameters. In this model the parameters we want to examine are cLocal2, pLocalToDead and cAE. The figure below shows the distributions which have been selected to represent the uncertainty around each parameter.
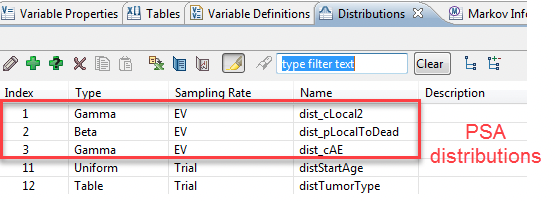
We have changed the parameters to equal the distributions we want to use for PSA (via the Variables View) such that:
-
cLocal2 = dist_cLocal2
-
pLocalToDead = dist_pLocalToDead
-
cAE = dist_cAE
If we ran regular Microsimulation on the model, the PSA/EV distributions are not sampled, and their mean values are used in the analysis. When we run PSA and Microsimulation, then they will be sampled.
To perform probabilistic sensitivity analysis on a microsimulation model:
-
Select the root node.
-
Choose Analysis > Monte Carlo Simulation > Sampling + Trials from the menu. OR
-
Use the tool bar and select the double dice icon in the Analyze perspective.
-
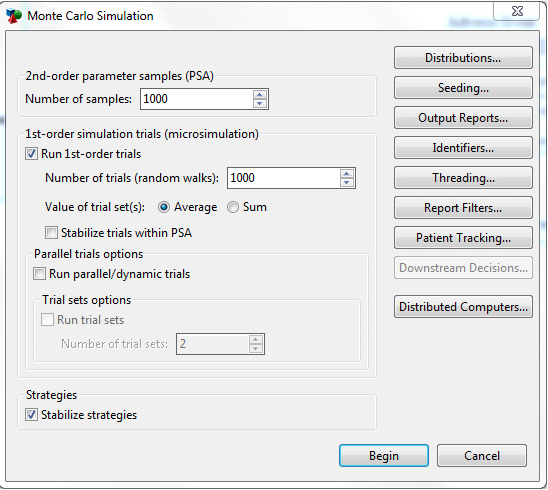
In the Monte Carlo Simulation dialog:
-
Enter the number of 2nd-order parameter samples, 1,000. This is 1,000 PSA samples.
-
Check the box to "Run 1st order trials" and enter 1,000 as the number of trials. This is 1,000 trials. This number should equal the same number required for the Base Case.
-
Check the box "Stabilize trials within PSA" to ensure stability in the 1,000 trials. Checking this box means that any variation is due to the samples as opposed to the trial group.
-
-
Press Begin.
Important note: The number of samples and trials required for stable, accurate results depends greatly on the complexity of the model. For a helpful discussion of determining the number of samples (outer loop= N) and trials (inner, microsimulation loop=n) required to support your analysis objectives, refer to:
-
“Monte Carlo Probabilistic Sensitivity Analysis for Patient Level Simulation Models,” Anthony O'Hagan, et al, Health Economics, 16:1009–1023 (2007).
The check box "Stabilize trials within Sensitivity analysis" is automatically selected. This ensures the same sequence of random numbers is used for patients passing through the model.
Interpreting a probabilistic sensitivity analysis in a microsimulation model
First lets understand what running PSA and microsimulation has done:
-
The model samples from each distribution with a resampling rate per EV to create a sample set defining the parameters for that model calculation.
-
The model calculation runs Microsimulation for that parameter set.
-
Each trial enters the model and is assigned characteristics from distributions in the model which are resampled per trial.
-
The trial then runs through the model via a random walk.
-
Repeat steps i and ii for the all remaining trials.
-
Aggregate the final results from all 1,000 trials finished, reflecting the model calculation for that set of parameters.
-
-
Repeat Steps 1 and 2 until all samples are complete (1,000 in this run).
The output will be presented as the Monte Carlo Dashboard.
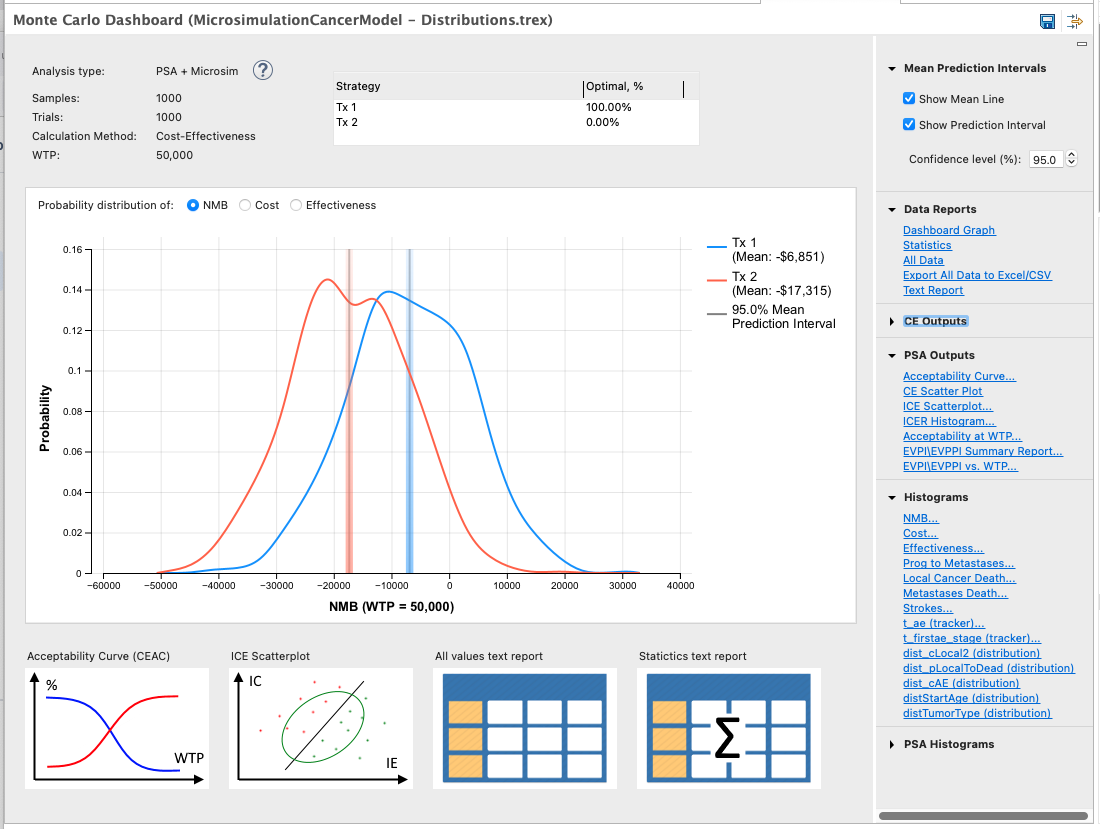
The output of the simulation will report the summary across all the microsimulation Expected Values. To look into the details further, open the Statistics text report. The statistics are calculated in the following way:
-
Each model recalculation (from a set of trials, microsimulation) is averaged to produce overall mean values reflecting all model recalculations. This is not the primary focus of the analysis, as we are more interested in what happened during individual calculations than the overall summary.
-
The resulting output includes PSA outputs to interpret the results.
If you select the "All Data" under the Data Report section on the right-hand side of the dashboard, TreeAge Pro will display in each single row, the results of a microsimulation. Each iteration (i.e. sample), reports average values for payoffs, trackers and distribution samples, based on the iteration’s group of trials.
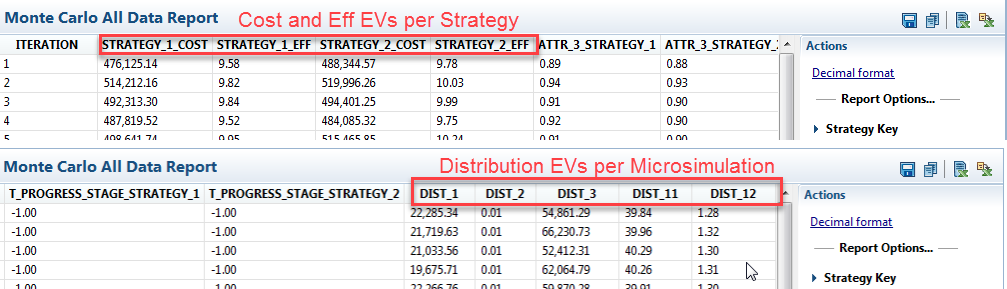
It provides averages, each simulating an expected value calculation by averaging the results of multiple trials.
In essence, a mean value from a group of trials is estimating expected value (EV) for the model. Within the context of probabilistic sensitivity analysis (PSA), this EV estimate is used the same way as the EV calculations from PSA described in the Probabilistic Sensitivity Analysis on CE Models section. These PSA outputs are the same, just that each model recalculation used Microsimulation.
The tracker values reported for 2-dimensional simulations, which sample distributions and then run microsimulation trials for each set of sample values, are averages for each group of trials run for a particular set of parameter samples.
