42.4 Analysis for Parallel Trials/Synchronization
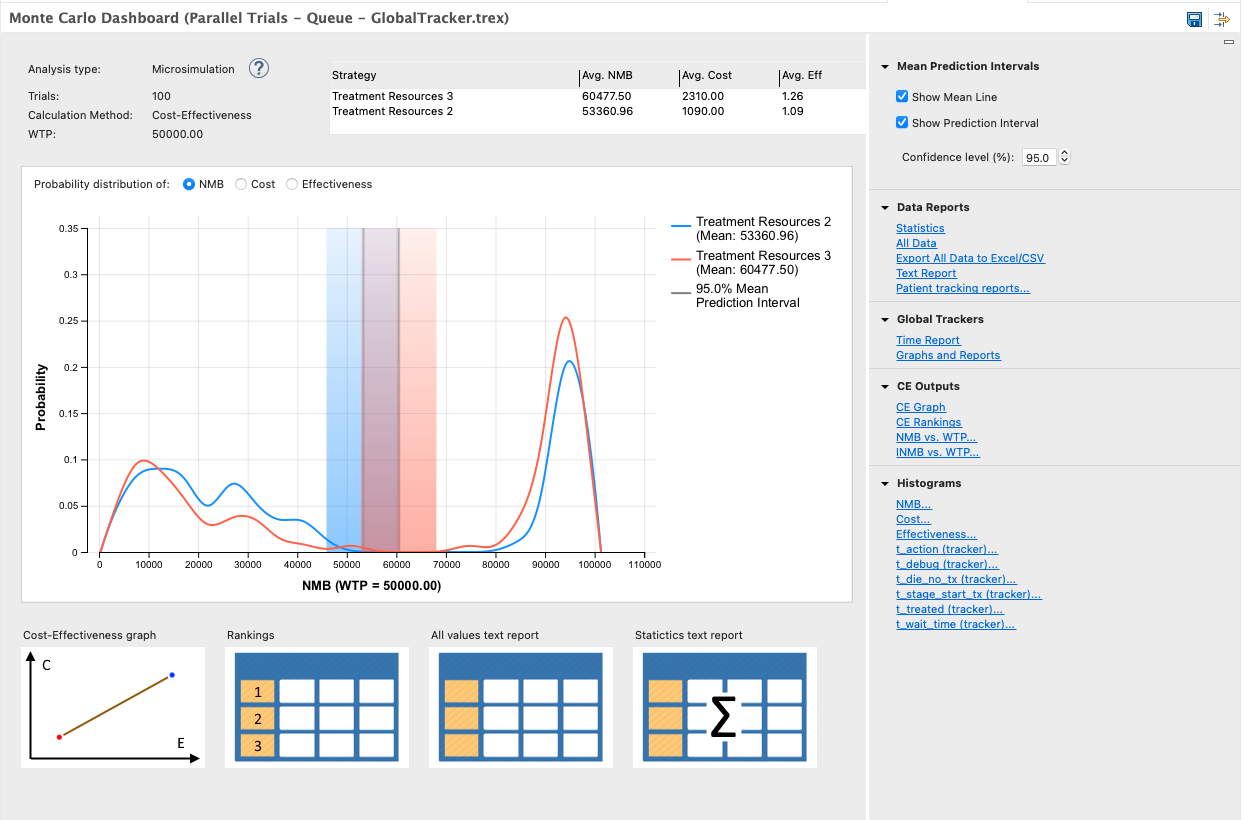
The Healthcare tutorial example tree Parallel Trials - Queue - GlobalTracker.trex is a cost effectiveness model where trials accumulate costs and effectiveness depending on their health state and treatment received. There are two strategies, one with 2 available resources and the other with 3 available resources.
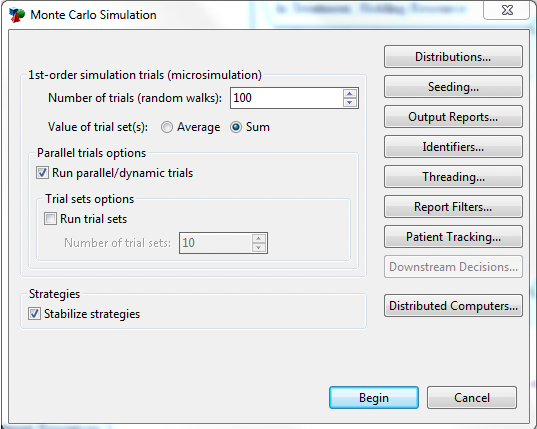
To run Microsimulation with parallel trials:
-
Select the root node.
-
Choose Analysis > Monte Carlo Simulation > Microsimulation from the menu.
-
Enter the number of trials as 100.
-
Select to report Average, rather than Sum for the "value of trial set(s)" option.
-
Within "Trial Sets options", do not check the box.
-
Click Begin.
The Microsimulation output for parallel trials is fundamentally the same as any other Microsimulation output. Refer to the Individual Level simulation Chapter, specifically the Microsimulation Results section for more details.
The Patient Tracking Reporting is on for this model, so we can examine what happened to the individuals within the simulation at each step. Let's first examine the cohort-level time report for the first strategy. In Data Reports, select Patient tracking reports and then Cohort report (for Treatment Resources 2). Then open the Charts > State Probabilities graph.
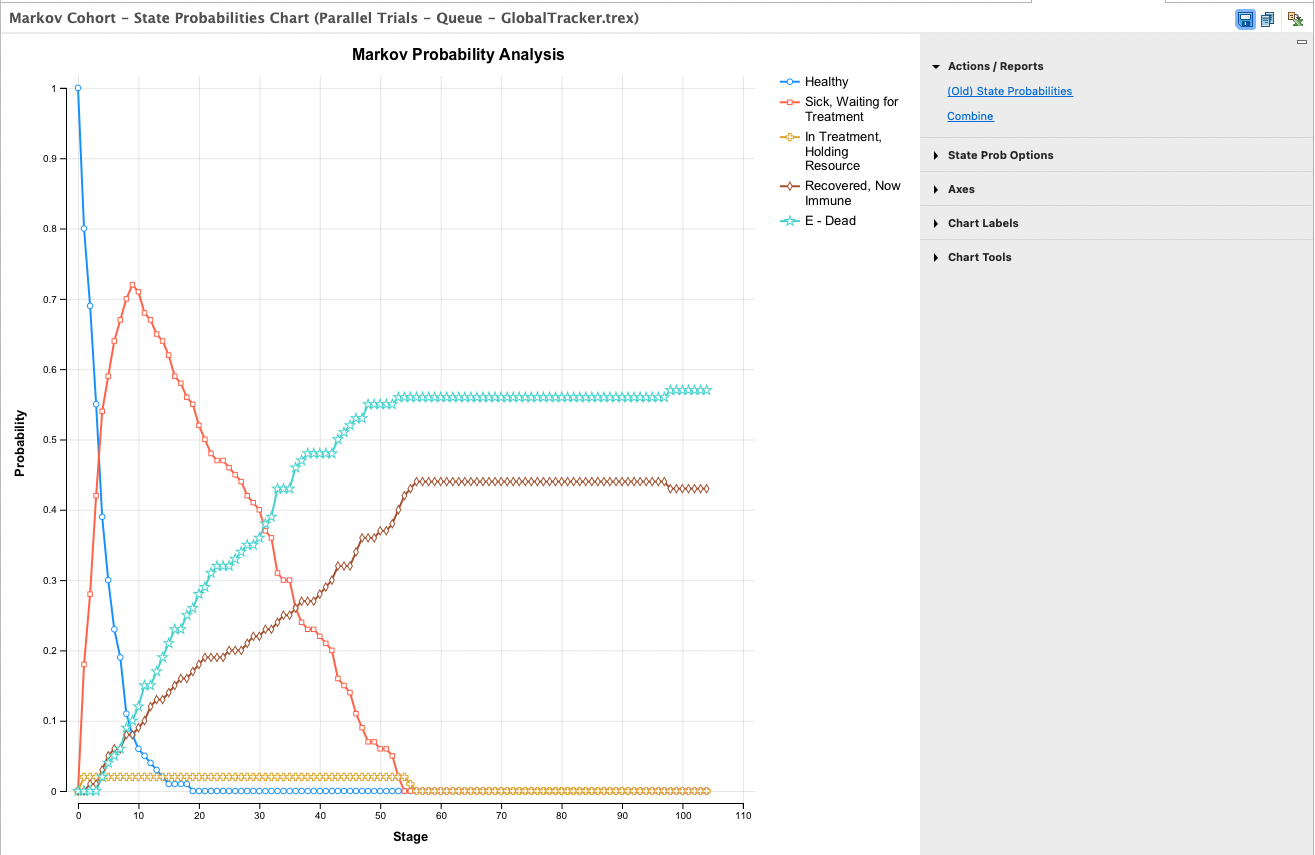
This State Probability graph displays population count rather than a percentage of the cohort on the vertical axis because we selected the Value of Trial sets option Sum rather than Average. Note for Strategy 1 no more than 2 individual can be in the In Treatment, Holding Resource state at any time. Also note that after about 60 cycles, no more individuals need treatment.
Let's compare this to the same graph for the other strategy as shown below.
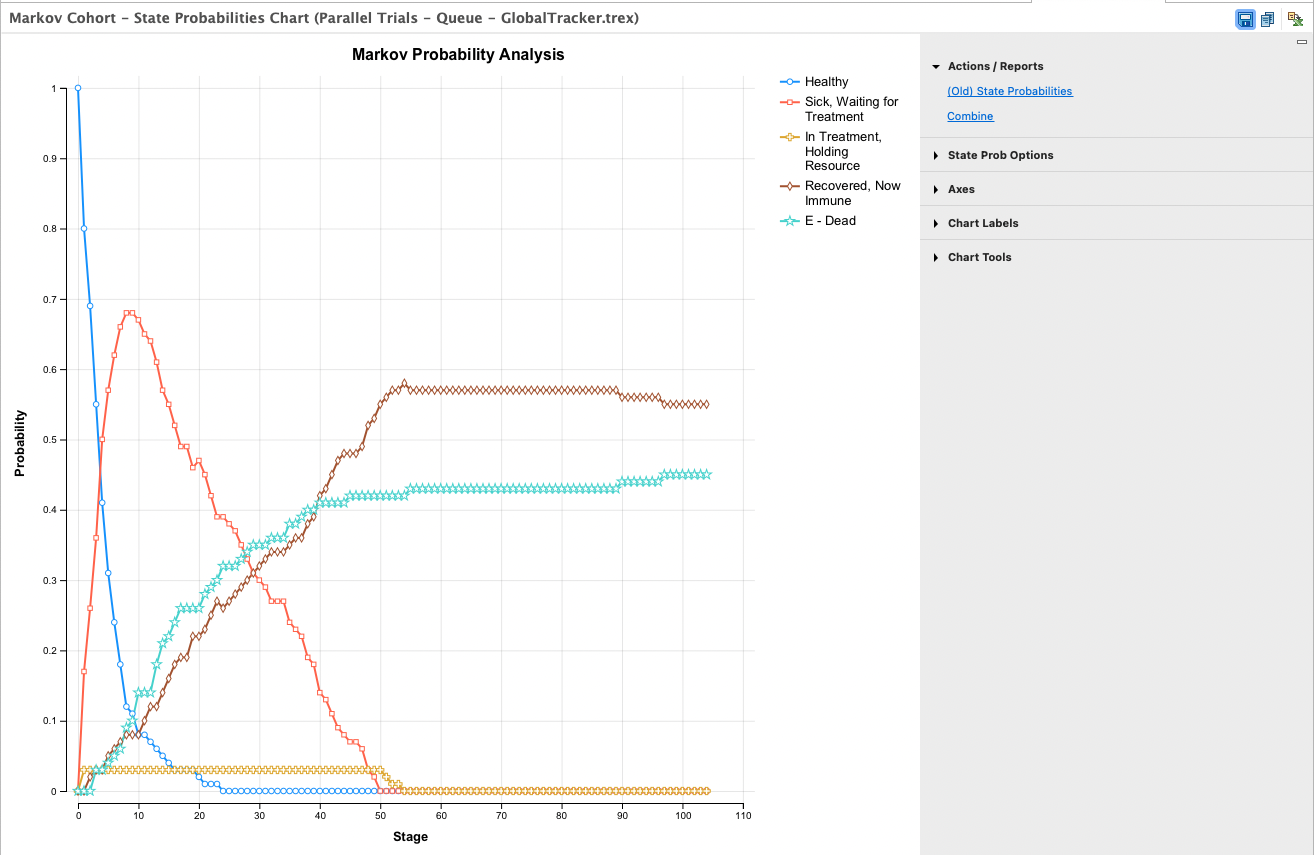
For Strategy 2, no more than 3 individuals can be in the In Treatment, Holding Resource state at any time. After about 50 cycles, no more individuals need treatment (Sick, waiting for Treatment becomes 0).
We used Global Trackers in our model and so we have access to three report options. Under Global Trackers (in the right hand side menu) there is the option to look at the Time Report. This is the first figure shown below, with time increasing horizontally across the page and Global Tracker values reported accordingly.
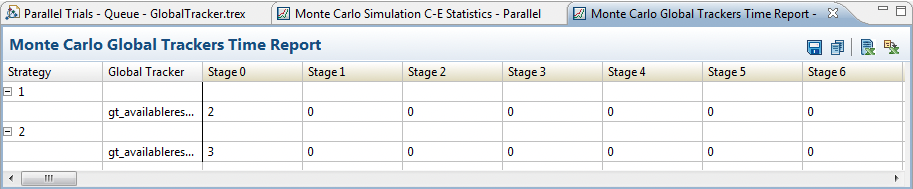
This report shows the value of the Global Tracker for each strategy at the beginning of each cycle. If you scroll to the right, you will see that eventually the resources are no longer in use.
Under Global Trackers there is a link to Graphs and Reports. This provides the option to see any of the Global Trackers values for any of the Strategies using the dialogue, as below.
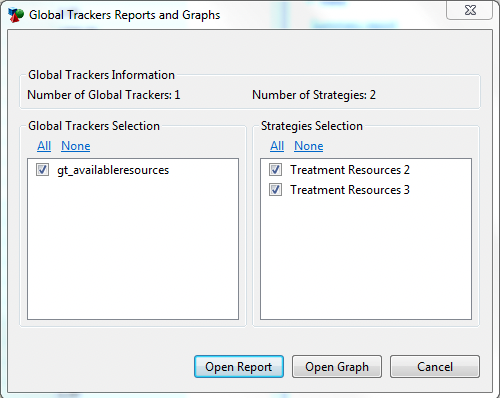
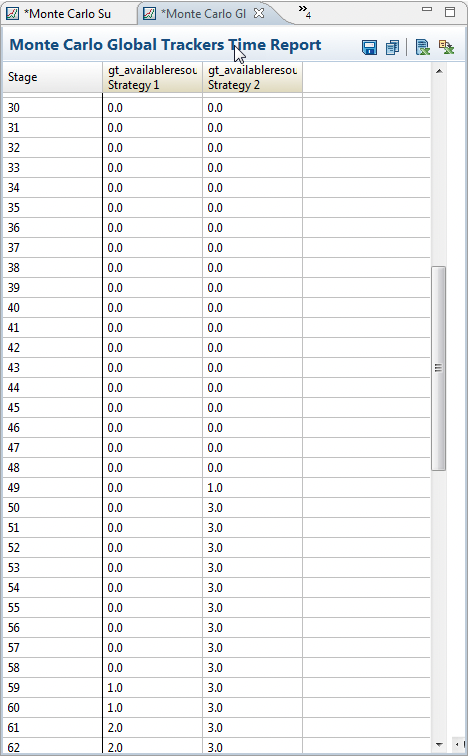
With the Open Report option, a report showing values of the trackers selected as they change over time is created.
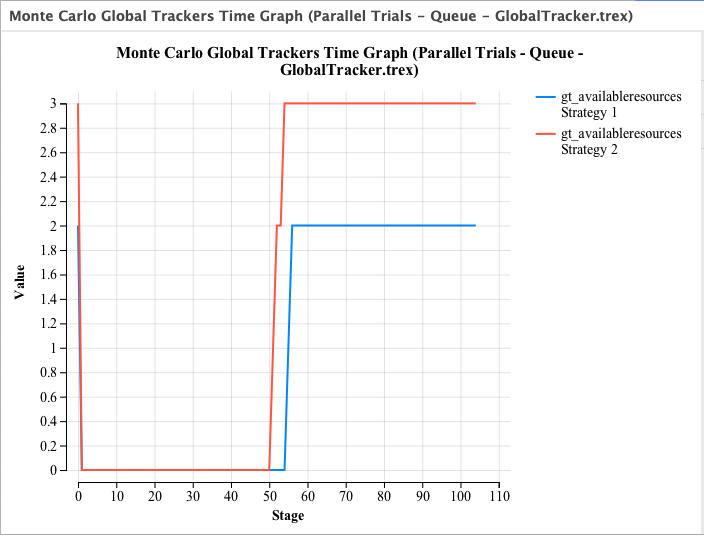
With the Open Graph option, a graphical representation of Stage versus value of the Global Trackers is generated. It has a key to quickly see the evolution of the tracker values.
Finally, the Rankings report below shows an overall comparison by strategy.
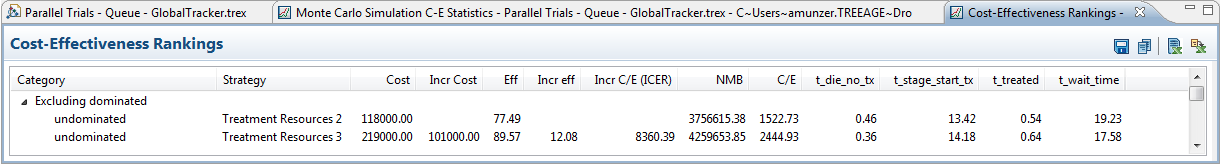
Note that the Treatment Resource 3 strategy had more people receive treatment (t_treated) and fewer people die without treatment (t_die_no_tx). It may at first appear that people received treatment sooner (t_stage_start_tx) in the Treatment Resource 2 strategy; however, this is misleading because more trials would have a 0 for never treated within that strategy.
