31.10 Sensitivity Analysis on Tables
Some model inputs may be entered in tables - particularly values that vary by time. This section focuses on sensitivity analysis for model inputs entered in tables.
The Healthcare Example model Markov Cancer - Table.trex includes 2 table inputs representing changing probabilities of progression by year.
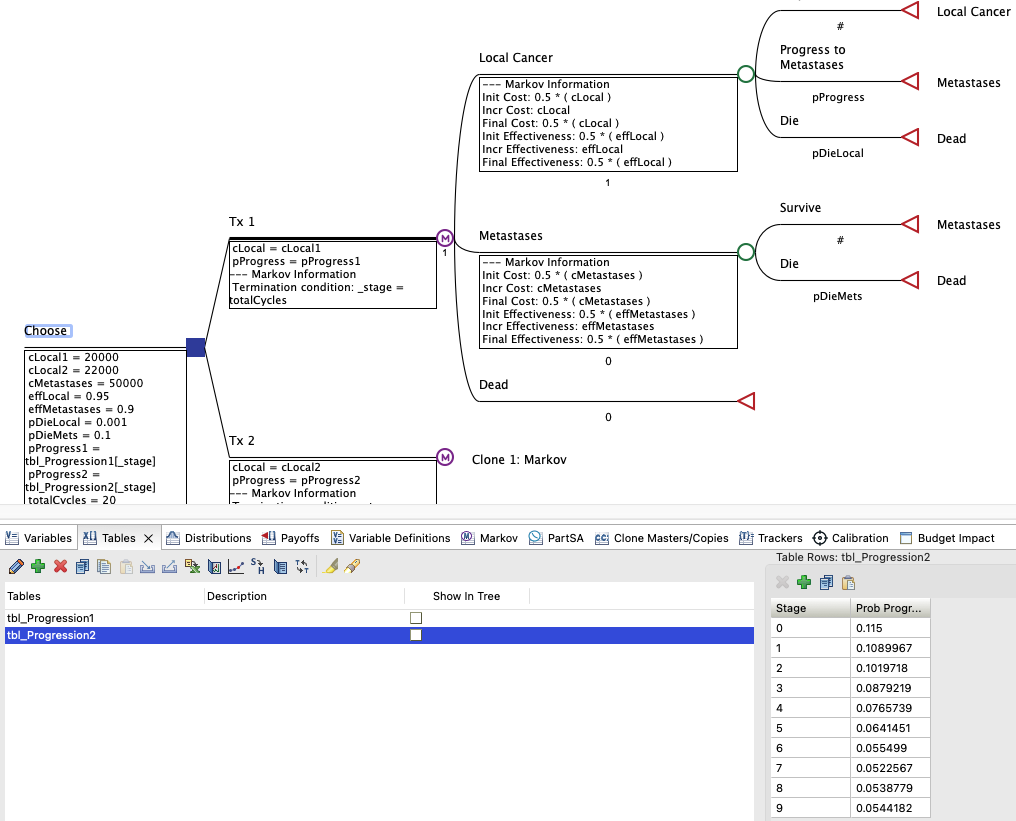
To setup the table input for sensitivity analysis:
-
Choose Tree > Expand Table for Sensitivity Analysis from the menu.
-
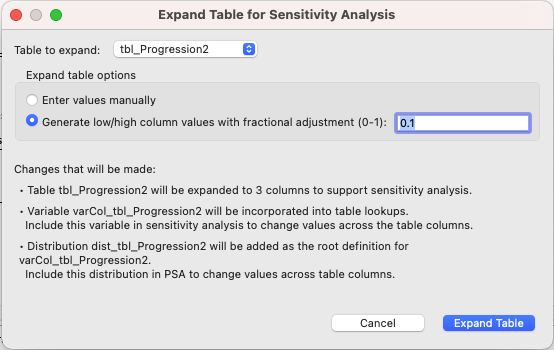
Select the table to expand.
-
Elect whether to auto-populate the sensitivity analysis table entries automatically or enter them manually.
-
Click the Expand Table button.
The model is now ready for sensitivity analysis on the table values. Note that the table tbl_Progression2 has been split into 3 columns for low, base case and high values.
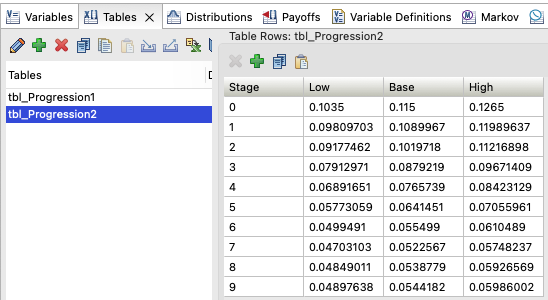
The table lookups have been modified to include a new variable and distribution based on the table name for selecting the column where data should be pulled.

For deterministic sensitivity analysis: varCol_tbl_Progression2 will run for sensitivity analysis range 1-3 to move through the low to base case to high values in the table.
For probabilistic sensitivity analysis: distribution dist_tbl_Progression2 is a Pert distribution that also varies from 1-3, but in a semi-normal shape that favors values closer to the mean over values at the edges of the uncertainty range.
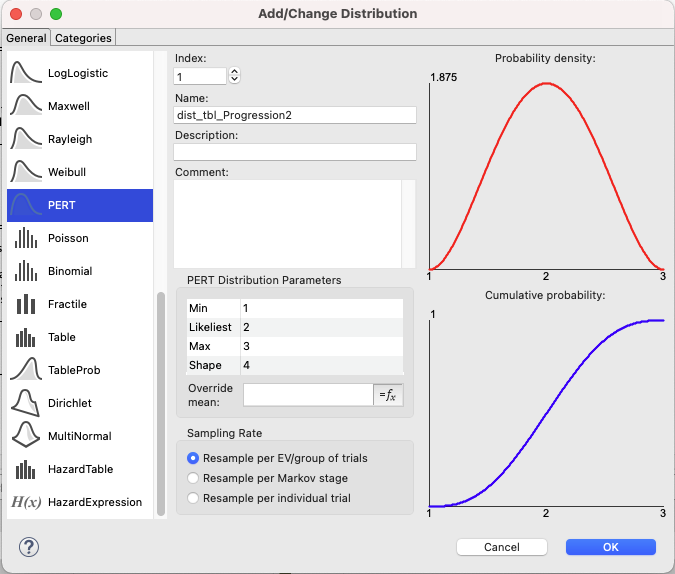
Once the table is expanded, you can adjust the values in the tables and the shape of the distribution to best fit your uncertainty range.
You can run both deterministic sensitivity analysis and probabilistic sensitivity analysis as described in other sections of this chapter.
