32.5 Custom Scatterplots
Within the Data Reports group, there is the ability to create Scatterplots with any of the payoffs, outcomes or distributions sampled for the PSA.
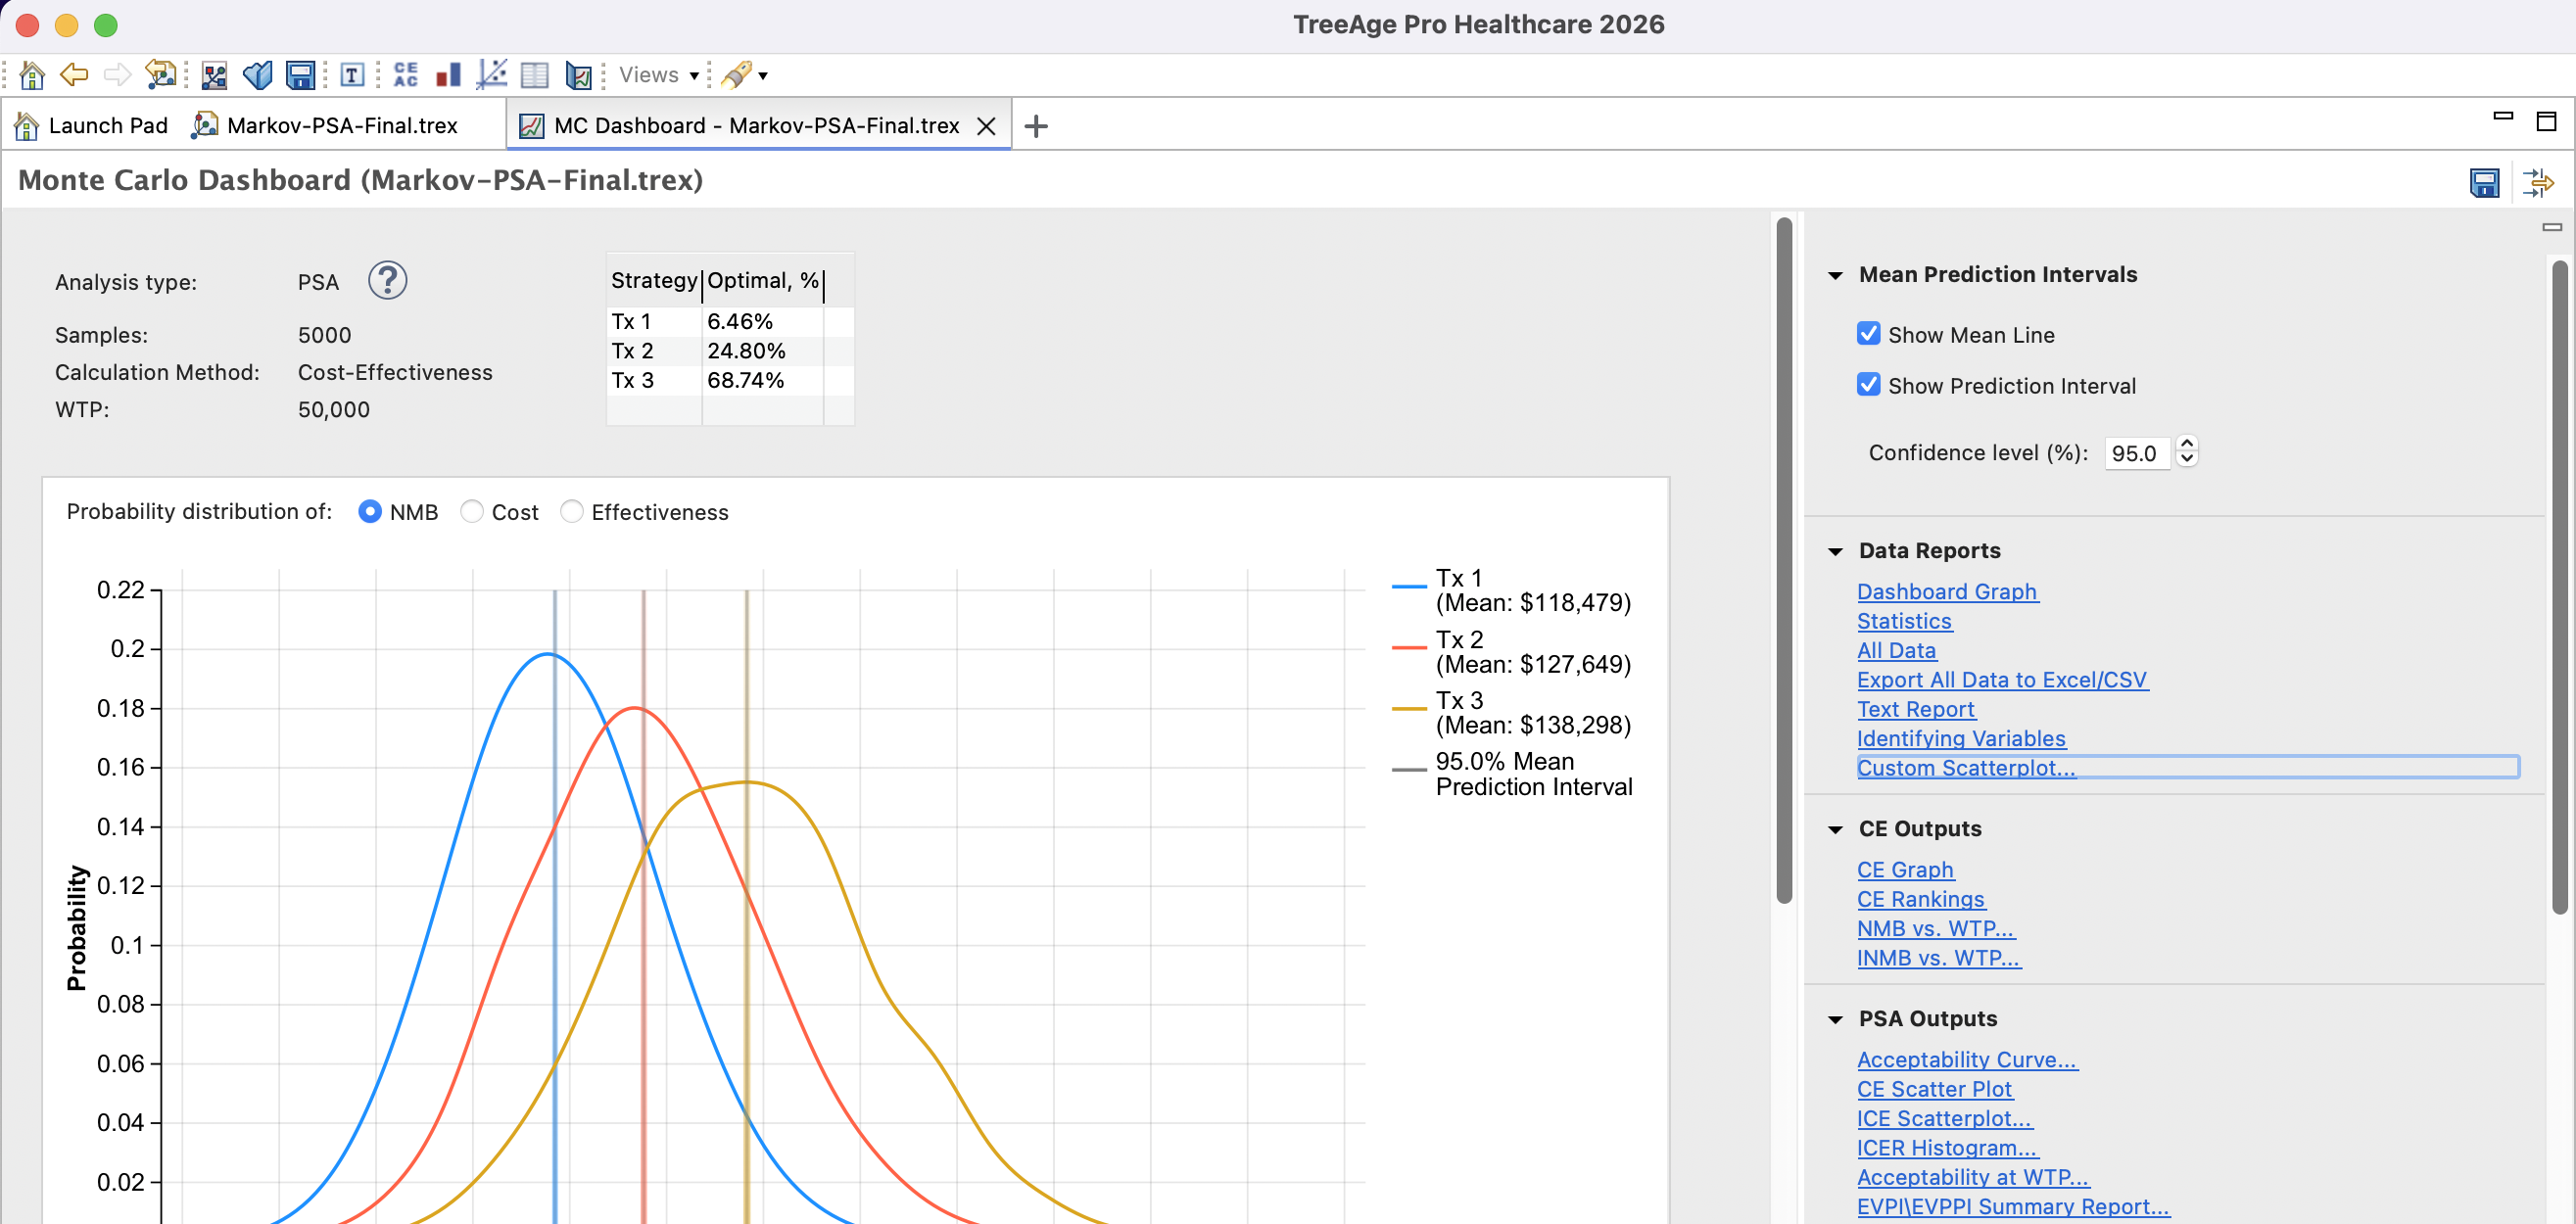
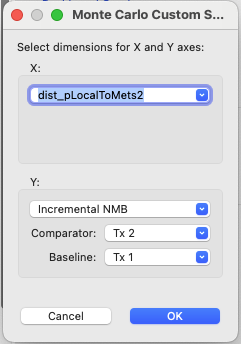
Select the option to open the Custom Scatterplots then choose the values to display on the X-axis and Y-axis. Values for the axes fall into 3 categories.
-
Outcome values for a strategy (e.g., cost, effectiveness, other payoffs).
-
Incremental values for a comparator vs. baseline strategy pair (e.,g., incremental cost, incremental effectiveness, ICER, INMB).
-
Independent values (e.g, distributions).
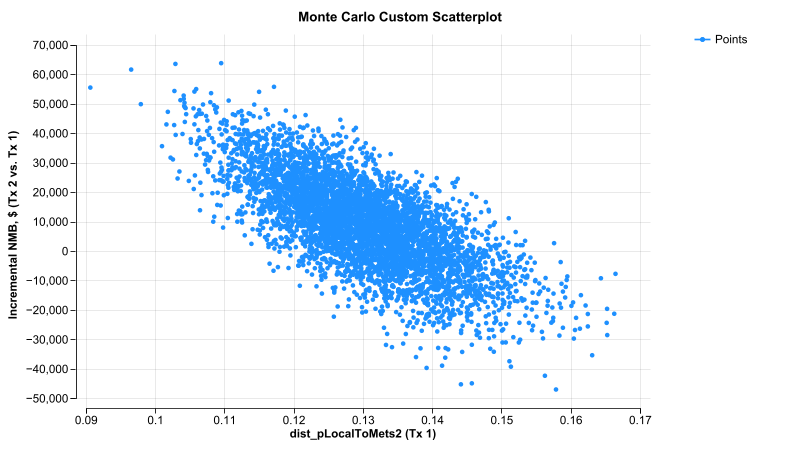
The options presented below show the distribution samples for the progression probability for strategy 2 (dist_pLocalToMets2) vs. the incremental net monetary benefits (INMB) of Tx 2 vs. Tx 1.
Not surprisingly, for higher values for the Tx 2 progression probability, the INMB (Tx 2 vs. Tx 2) generally goes down because Tx 2 will have worse health outcome.