32.4 Data Reports
The Data Reports group provides access to individual model calculations and statistics drawn from those calculations.
The link to the Dashboard Graph allows you to edit the Probability Distribution Graphs which are displayed on the dashboard, editing and using them as you can with all the other graphs.
The Statistics report displays aggregate statistical data for every model output - all payoffs, trackers and distributions.
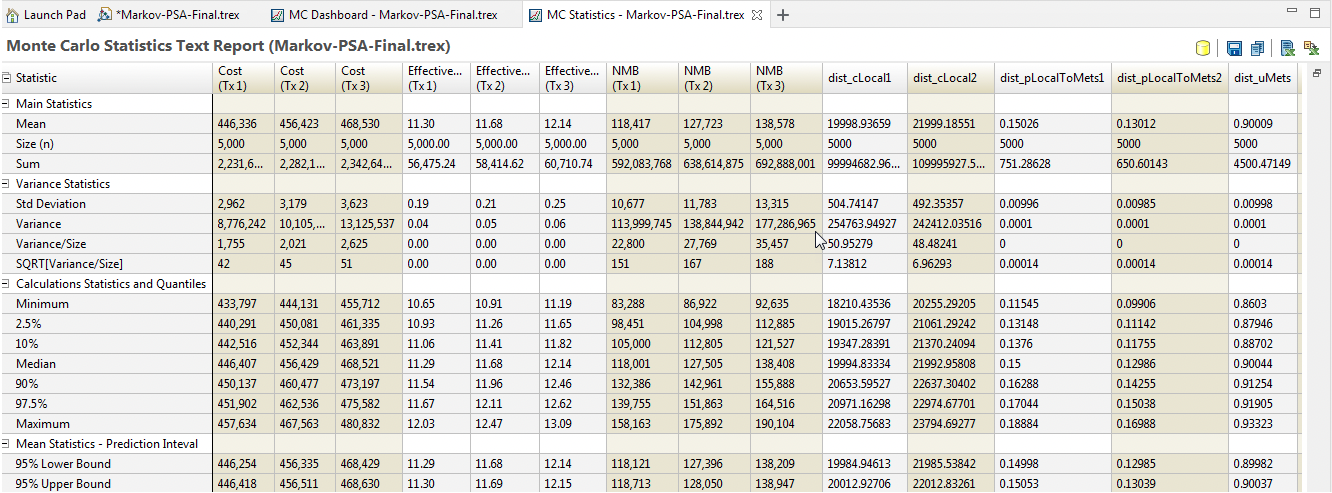
The Statistics Report includes controls to the right to change the percentages for the Prediction Interval mean statistics and to hide/show different data values. For more information on prediction intervals, refer to section Robustness of Simulation Results.
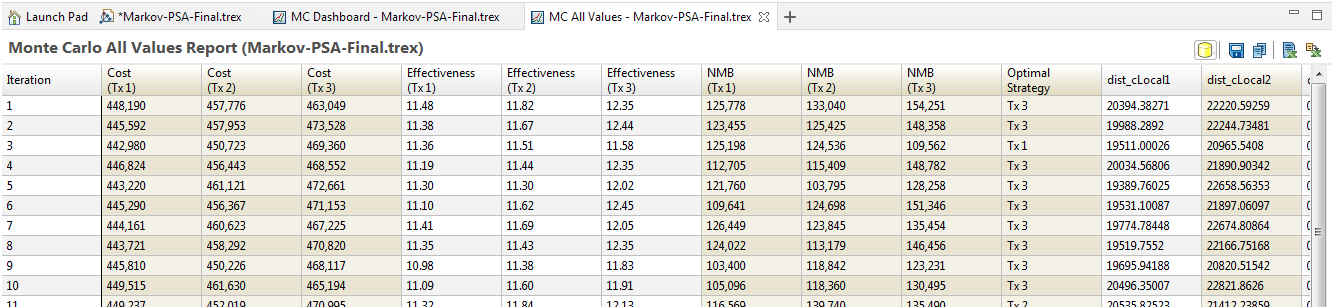
The All Data report displays every model output for each model calculation. In addition, the NMB is calculated for each strategy and the Optimal Strategy is identified as the strategy with the highest NMB.
The Export All Data to Excel/CSV link exports the same data from the All Data report to a CSV file easily opened in Excel.
The Text Report link presents an older format of aggregated simulation results.
