33.3 Model Analyses
In the Web Sharing Options dialog, you can designate the analyses which Reviewers can run on TPWeb in the Model Analyses tab.
The options available for Model Analyses are:
-
Add Analysis: Select this option to add a new analysis to the websharing model. More details below.
-
Remove analysis: With an analysis selected, use this to delete any analysis you no longer want to share.
-
Move Up / Move Down: Change the order of the analysis to be displayed in TPWeb.
The image below shows the Model Analyses options for the example model Markov Sharing - with sharing options.trex. Another example model Markov Sharing - before sharing options.trex does not already have the analyses setup.
To enable Roll Back analysis:
-
Check the "Enable Roll Back" box above the analysis list.
To add an analysis:
-
Click the Add analysis button.
-
Enter a Web Analysis Name to provide the model Reviewer with a description of what kind of analysis will be run.
-
Choose the type of analysis from the Choose Analysis Type drop-down.
-
Enter options for some analysis types. For example, Rankings for a cost-effectiveness model requires a WTP entry.
-
Add visible graphs and/or reports that can be generated for that analysis type.
Once the analysis are listed on the left hand side, you have the option to delete any analysis by selecting the analysis and then using the Remove Analysis option under the list. The order in which the analysis are presented can be changed using the Move Up/Move Down buttons which are below the list.
If you are adding multiple analyses, use the Save button between each new analysis you want to add before moving onto the next. Once you have finished with adding all the analyses, select Save & Close to exit the Web Sharing Options wizard.
Lets look at each analysis type and the options available for each.
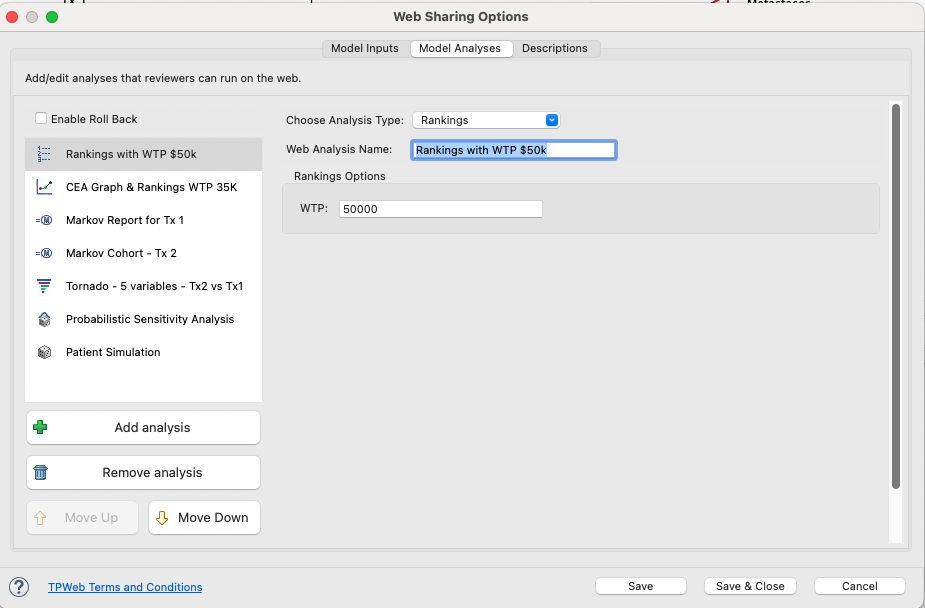
33.3.1 Rankings
To add Rankings as an analysis to run on TPWeb:
-
Click "+ Add Analysis" from the bottom left hand side to create a new TPWeb analysis.
-
Enter an appropriate analysis name, perhaps something like "Rankings with WTP $50k". Note that a specific name like that would allow you to distinguish between multiple Rankings analyses with different WTPs.
-
Choose "Rankings" from the Choose Analysis Type drop-down menu.
-
Enter the Rankings Options value for WTP as 50000.
-
Select Save to save the analysis (in this case Rankings) before you proceed to add more analyses.
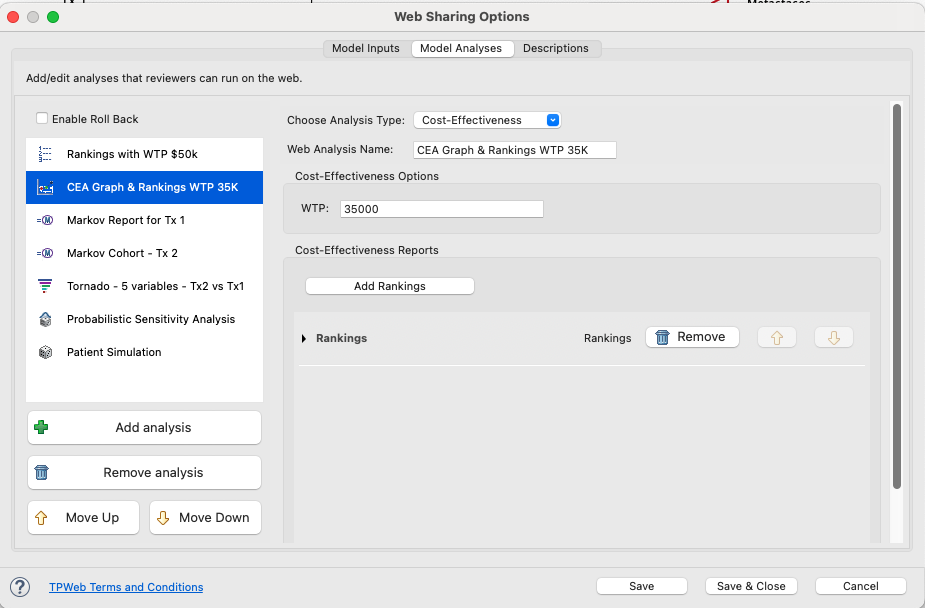
33.3.2 Cost-Effectiveness Analysis
To add Cost-Effectiveness as an analysis to run on TPWeb:
-
Click "+ Add Analysis" from the bottom left hand side to create a new TPWeb analysis.
-
Enter an appropriate analysis name.
-
Choose "Cost-Effectiveness" from the Choose Analysis Type dropdown menu.
-
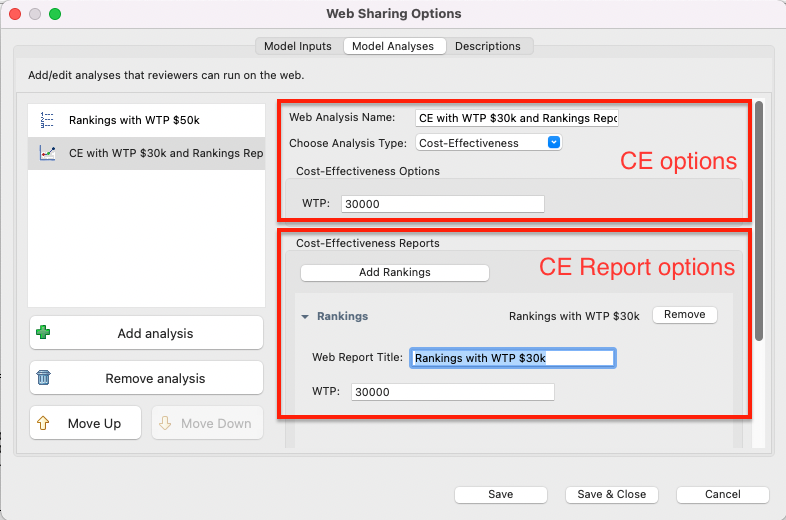
In Cost-Effectiveness Options, enter/edit the value for WTP. The default value is pulled from Tree Preferences.
-
Add/edit secondary reports:
-
By default, this analysis will include both the primary output CEA graph and an additional Rankings report.
-
Rankings report include an option for WTP that can be edited.
-
You can add/delete more Rankings reports. Each Rankings report can be run with a different WTP value.
-
-
Select Save to save the analysis (in this case Rankings) before you proceed to add more analyses.
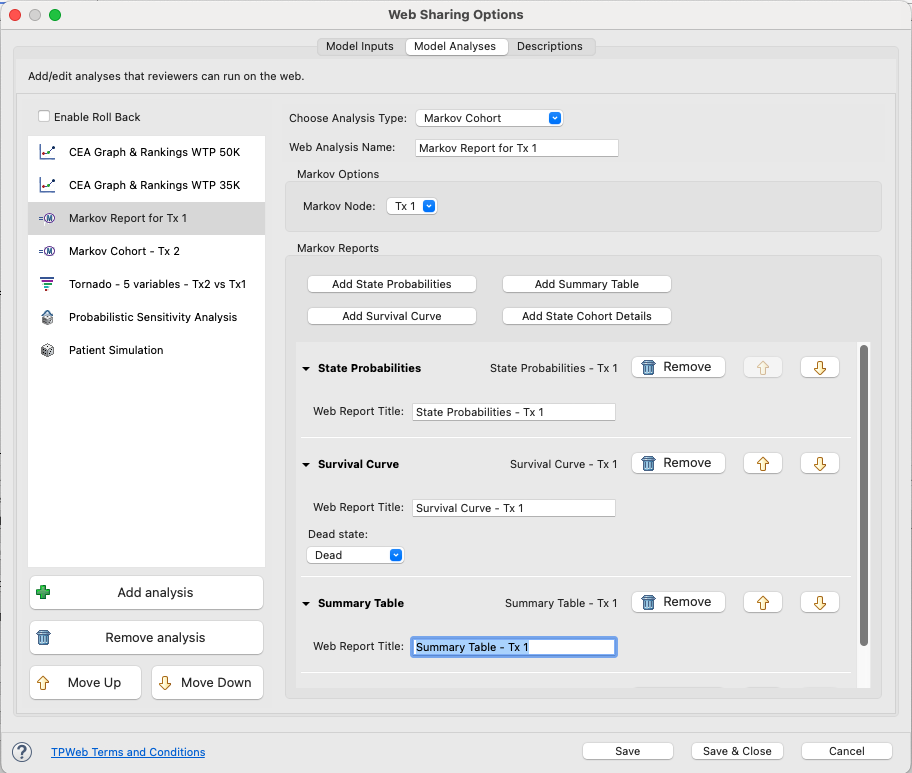
33.3.3 Markov Cohort
To add Markov Cohort as an analysis to run on TPWeb:
-
Click "+ Add Analysis" from the bottom left hand side to create a new TPWeb analysis.
-
Enter an appropriate analysis name.
-
Choose "Markov Cohort" from the Choose Analysis Type dropdown menu.
-
In Markov Options, choose the desired Markov node from within the model.
-
Add/edit secondary reports:
-
There are four secondary Markov Reports available for Markov Cohort Analysis in TPWeb. The first three are added automatically.
- State Probabilities: generates a graph showing how state membership changes over time.
-
Survival Curve: generates a graphs showing declining survival over time. For this graph, make sure the Dead state is selected appropriately.
-
Summary Table: generates a summary table of state membership and the accumulation of value over time.
-
State Cohort Details: generates a detailed table of state membership and the accumulation of value by state over time. This table can be quite large.
-
You can add/delete more reports as needed.
-
You can edit the Web Report Title for any of these graphs/reports to make it easily recognizable for the Reviewer on TPWeb..
-
-
Select Save to save the analysis (in this case Rankings) before you proceed to add more analyses.
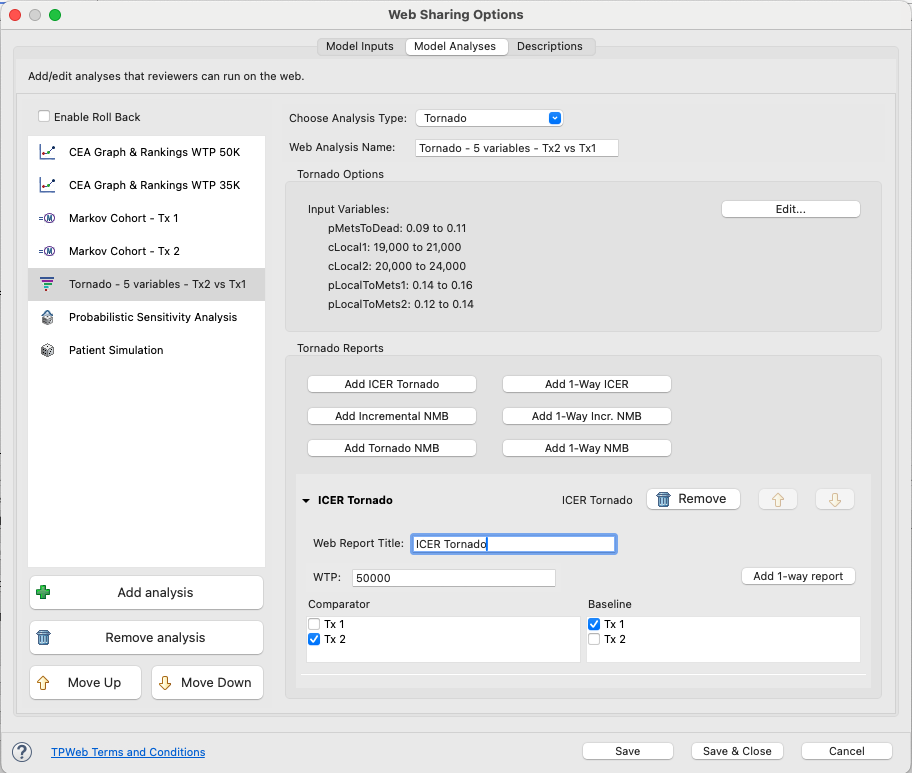
33.3.4 Tornado
To add Tornado as an analysis to run on TPWeb:
-
Click "+ Add Analysis" from the bottom left hand side to create a new TPWeb analysis.
-
Enter an appropriate analysis name.
-
Choose "Tornado" from the Choose Analysis Type drop-down menu.
-
In Tornado Options, choose variables/ranges for each input to include in the tornado analysis. Note that these will default from the last tornado run within TreeAge Pro, but you can override those options here for TPWeb by clicking the Edit button. The dialog to choose variables and set ranges is the same as is used when executing the tornado diagram within TreeAge Pro desktop.
-
Add/edit secondary reports:
-
There are various secondary reports available for Tornado analysis in TPWeb. The first is added automatically.
- ICER Tornado: generates a tornado showing how the ICER between two strategies changes based on parameter uncertainty.
- Options: the graph name, the WTP, a comparator strategy, and a baseline strategy.
- Note that you might choose to add more than one for different pairs of strategies.
- Incremental NMB: generates a tornado showing how the ICER between two strategies changes based on parameter uncertainty.
- Options: the graph name, the WTP, a comparator strategy, and a baseline strategy.
- Note that you might choose to add more than one for different pairs of strategies.
- Tornado NMB: generates a tornado showing how the NMB changes for one strategy or for all strategies.
- Options: the graph name, the WTP, and which strategies to include.
- Note that you might choose to add more than one for different strategies.
- 1-Way ICER: generates a 1-way ICER sensitivity graph.
- Options: the input variable, the WTP, the comparator and baseline strategies.
- Note that you might add several for different variables from tornado diagram inputs list.
- 1-Way Incr NMB: generates a 1-way INMB sensitivity graph.
- Options: the input variable, the WTP, the comparator and baseline strategies.
- Note that you might add several for different variables from tornado diagram inputs list.
- 1-Way NMB: generates a 1-way NMB sensitivity graph.
- Options: the input variable, the WTP, all strategies or a single strategy.
- Note that you might add several for different variables from tornado diagram inputs list.
- You can add/delete more reports as needed.
-
-
Select Save to save the analysis (in this case Rankings) before you proceed to add more analyses.

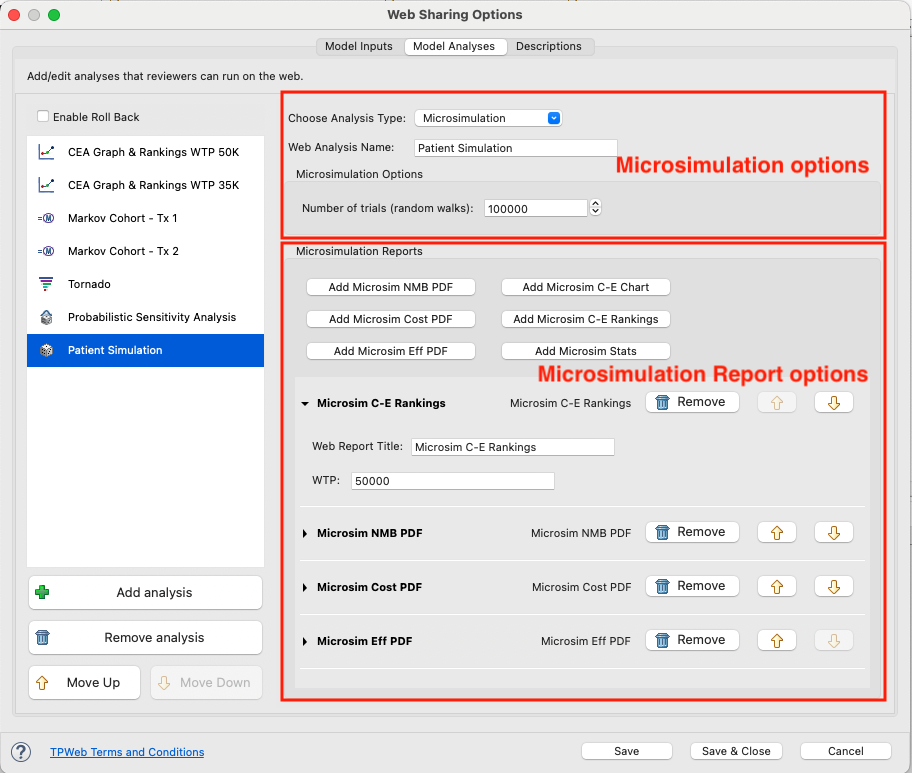
33.3.5 Microsimulation (Patient Level Simulation)
To add Microsimulation analysis to run on TPWeb:
-
Click "+ Add Analysis" from the bottom left hand side to create a new TPWeb analysis.
-
Enter an appropriate analysis name.
-
Choose "Microsimulation" from the Choose Analysis Type drop-down menu.
-
In Microsimulation Options, choose the Number of Trials (patients/random walks) required for analysis.
-
Add/edit secondary Microsimulation reports:
-
There are five secondary Microsimulation Reports available for Microsimulation in TPWeb. The first three are added automatically.
- Microsim NMB PDF: generates a probability distribution trend line for each strategy showing the Net Monetary Benefit (NMB) mean and variance among trial runs.
-
Microsim Cost PDF: generates a probability distribution trend line for each strategy showing the Cost mean and variance among trial runs.
-
Microsim Eff PDF: generates a probability distribution trend line for each strategy showing the Effectiveness mean and variance among trial runs.
-
Microsim C-E Chart: generates a cost-effectiveness graph based on the average cost and effectiveness outputs for each strategy from the full set of trial runs.
-
Microsim C-E Rankings: generates a rankings report based on the average cost and effectiveness outputs for each strategy from the full set of trial runs.
-
You can add/delete more reports as needed. For most you need to add the NMB value from the dropdown menu.
-
You can edit the Web Report Title for any of these graphs/reports to make it easily recognizable for the Reviewer on TPWeb..
-
-
Select Save to save the analysis (in this case Microsimulation) before you proceed to add more analyses.
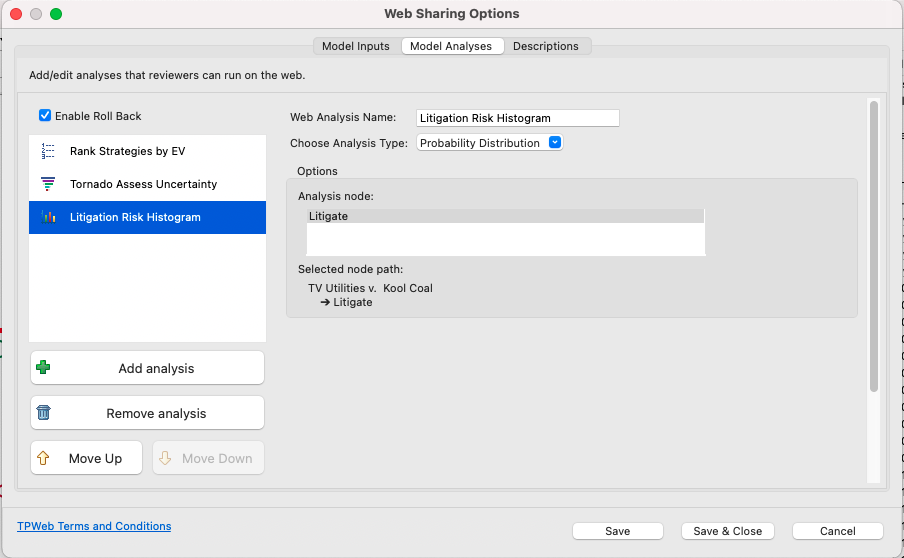
33.3.6 Probability Distribution Graphs
Probability distribution graphs show the likelihood of various ranges of values to occur for a strategy. Note that this is only valid for decision tree models (not Markov, PartSA, DES) with the calculation method of simple. Note the screen print below is from a legal model.
To add Probability Distribution as an analysis to run on TPWeb:
-
Click "+ Add Analysis" from the bottom left hand side to create a new TPWeb analysis.
-
Enter an appropriate analysis name.
-
Choose "Probability Distribution" from the Choose Analysis Type dropdown menu.
-
Select a strategy node.
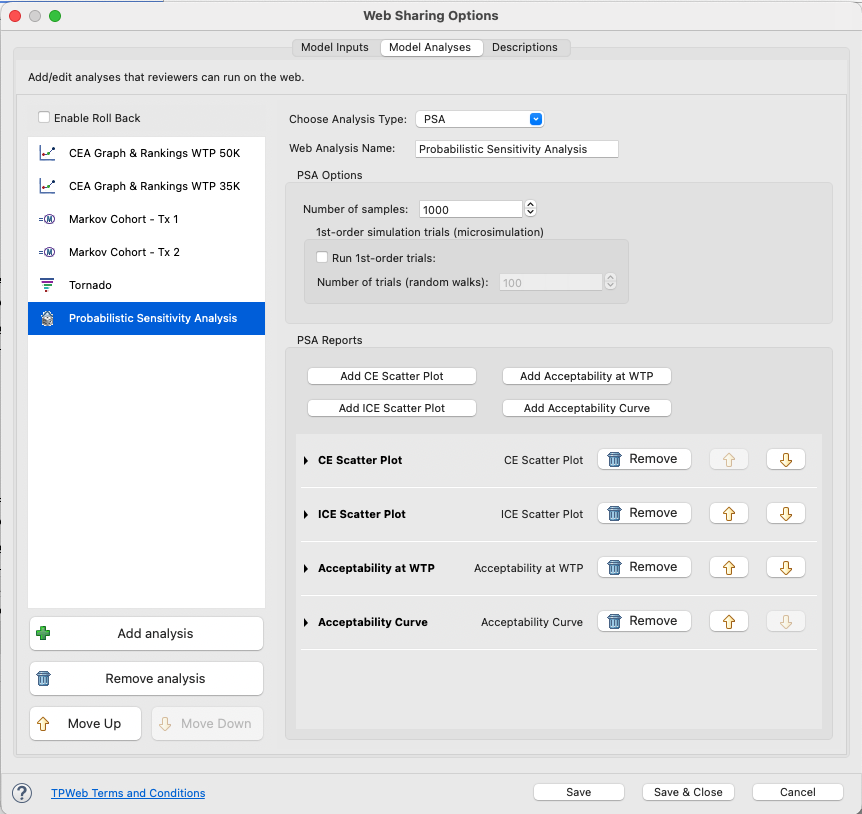
33.3.7 Probabilistic Sensitivity Analysis (PSA)
Probabilistic Sensitivity Analysis shows the impact of combined parameter uncertainty by presenting results from multiple model runs with parameter values sampled from distributions..
The example model PartSA-Decision_PSA_Webshare.trex provides an example of web sharing where we have already set up the PSA analyses.
To add Probabilistic Sensitivity Analysis in TPWeb:
-
Click "+ Add Analysis" from the bottom left hand side to create a new TPWeb analysis.
-
Choose "PSA" from the Choose Analysis Type dropdown menu.
-
Enter an appropriate Web Analysis Name. In the image below "Probabilistic Sensitivity Analysis".
-
In PSA Options, choose the Number of Samples required for analysis.
-
If the model is also a Microsimulation model you can select to also Run 1st-order trials by checking the box and setting the Number of Trials (random walks).
-
-
Add/edit secondary PSA Reports:
-
There are four secondary PSA Reports available for PSA in TPWeb. They are all added automatically.
- CE Scatter Plot: generates a plot of model calculations for each strategy.
-
ICE Scatter Plot: generates a plot of incremental cost and incremental effectiveness based on a pair of selected strategies.
-
Acceptability at WTP: generates a report showing the percentage of calculations which found each strategy to be the most cost-effective at a given WTP.
-
Acceptability Curve: generates a line graph showing the percentage of calculations which found each strategy to be the most cost-effective across a range of WTP.
-
You can add/delete more reports as needed. For most you need to add other details such as the WTP or select strategies to compare including baseline and comparator strategy.
-
You can edit the Web Report Title for any of these graphs/reports to make it easily recognizable for the Reviewer on TPWeb.
-
-
Select Save to save the analysis (in this case PSA) before you proceed to add more analyses.
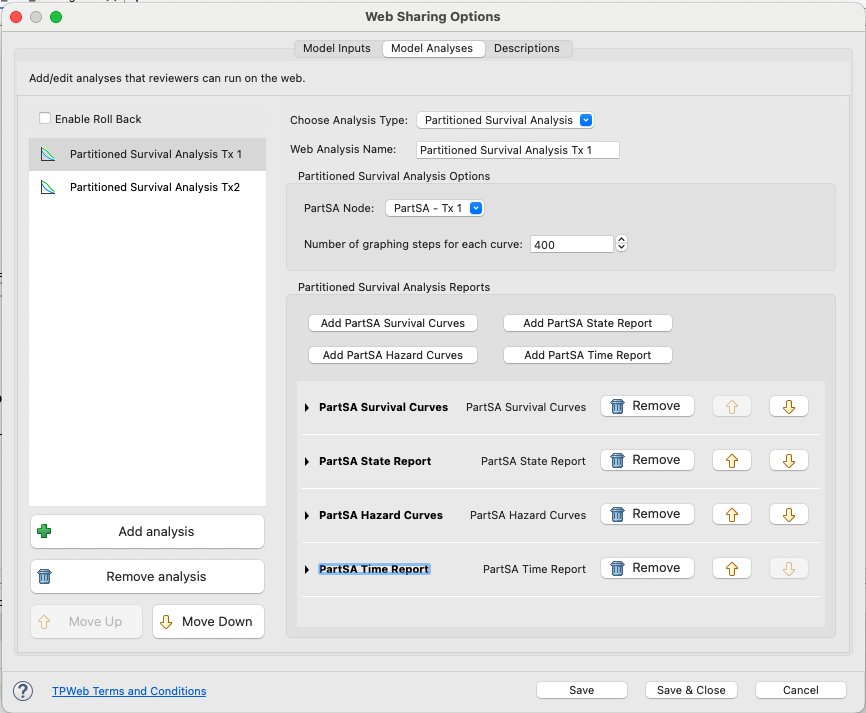
33.3.8 Partitioned Survival Analysis (PartSA)
The Partitioned Survival Analysis option in TPWeb creates a series of graphs and reports for Partitioned Survival models.
The example model PartSA-Decision_PSA_Webshare.trex provides an example of web sharing where we have already set up the PartSA analyses.
To add PartSA in TPWeb:
-
Click "+ Add Analysis" from the bottom left hand side to create a new TPWeb analysis.
-
Choose "Partitioned Survival Analysis" from the Choose Analysis Type dropdown menu.
-
Enter an appropriate Web Analysis Name. In the image below "Partitioned Survival Analysis Tx 1".
-
In Partitioned Survival Analysis Options, choose the PartSA Node - selecting the strategy usually.
-
In the option for number of graphing steps, the default is 400 and this can be left or adjusted as required.
-
-
Add/edit secondary Partitioned Survival Analysis Reports:
-
There are four secondary Partitioned Survival Analysis Reports available in TPWeb. The first two are added automatically.
- PartSA Survival Curves: plots each survival curve against time over the full time horizon.
- PartSA Hazard Curves:plots each survival curve's hazard function against time over the full time horizon.
-
PartSA State Report: generates a table which breaks down over all state membership and model outcome values by state.
-
PartSA Time Report: generates a table which breaks down the contents of the state report (above) into time periods (annual or monthly). This provides more visibility and transparency related to the movement of the cohort and the accumulation of value over time.
-
You can add/delete more reports as needed. You can edit the Web Report Title for any of these graphs/reports to make it easily recognizable for the Reviewer on TPWeb.
-
-
Select Save to save the analysis (in this case PartSA) before you proceed to add more analyses.