44.4 Using Hazards in a DES Model
In this section, we will integrate the CDC hazard table from section Calculating Hazards from Survival Data as our source data to build a Discrete Event Simulation (DES) model.
Healthcare Example Models Hazards-CDC-DES.trex includes the same KM_CDC_hazard table. For DES, the hazard table is referenced by a distribution that incorporates the changing hazard over time.
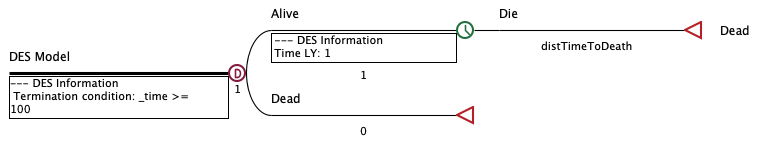
The example DES model itself is very simple. It has two health states with people moving from the Alive state to the Dead state based on samples from the distribution distTimeToDeath.
The distribution references the hazard table with increasing hazard rates over time. The survival function shown below in the dialog matches the original CDC K-M data.
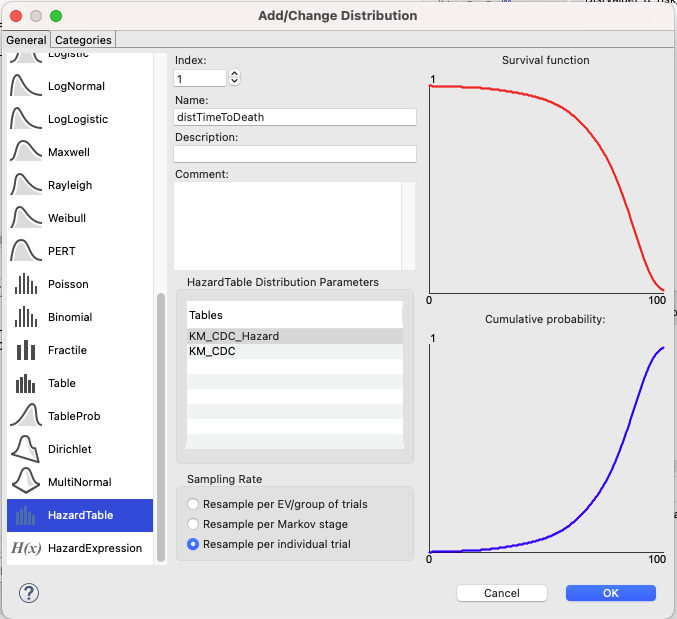
Note that a similar HazardExpression distribution type allows for the entry of a formula for the changing hazard against time rather than a hazard table.
Run Microsimulation (patient simulation) to analyze the model. Each simulated person will draw a different sampled time-to-death from the distribution (see sampling rate). One life year is accumulated for the continuous time spent in the Alive state prior to death.
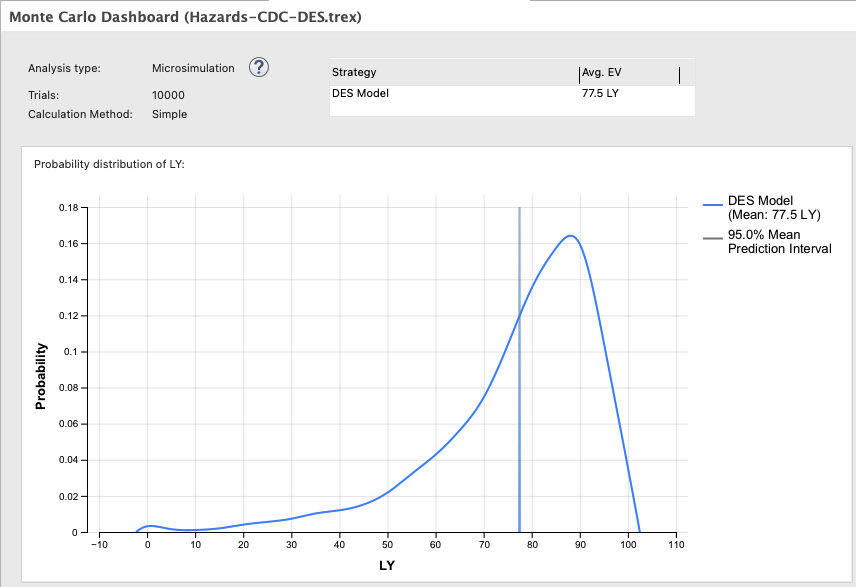
Note that the average life expectancy is 77.5, matching the results from the prior section's PartSA model that uses the same source data.
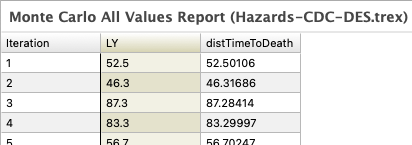
You can see the individual time-to death values by clicking on the All Data link in the simulation dashboard.