44.5 Using Hazards in a Markov Model
In this section, we will integrate the CDC hazard table from section Calculating Hazards from Survival Data as our source data to build a Markov model.
Healthcare Example Models Hazards-CDC-Markov.trex includes the same KM_CDC_hazard table. The example Markov model itself is very simple. It has two health states with people moving from the Alive state to the Dead state based on probabilities calculated from the hazard table.
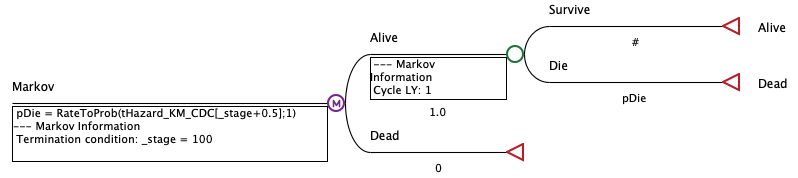
The probability pDie formula converts the hazard rate from the table to a probability for the 1-year cycle length.
-
pDie = RateToProb(tHazard_KM_CDC[_stage+0.5];1)
Note that the data is pulled from the table at _stage+0.5 to take the hazard at the mid-point of the cycle rather than at the beginning. This is more representative of the changing hazard over the course of a year.
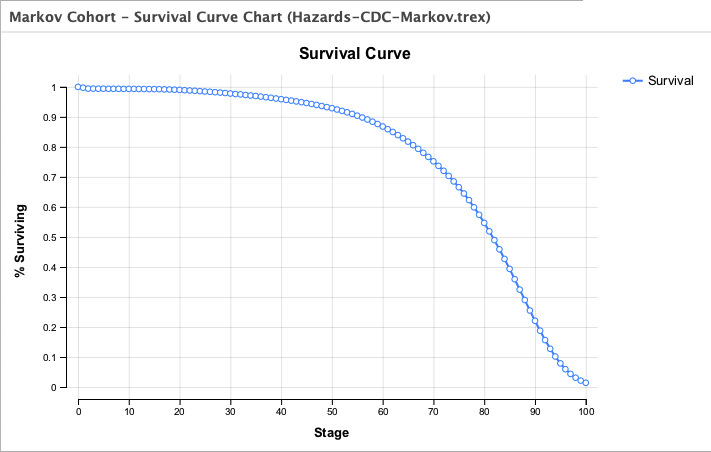
Run Cohort Analysis and generate a Survival Curve, and you see that it matches the survival curve from the original CDC data.
It is important to note an important difference between this Markov model and the Using Hazards in a PartSA Model.
-
PartSA - the hazard is applied to calculate overall survival.
-
Markov - the hazard is applied to calculate a single event probability. This model only has one event, so they match, but the Markov model could include additional competing events.
