45.4 Survival Plot - DistSurv and DistHazard Functions
This section uses the Survival Plot View to illustrate the DistSurv and DistHazard functions. Both functions accept a first argument that represents a time-to-event distribution - typically for a health event like progression or death.
-
DistSurv: returns the percentage of the cohort that has not yet experienced an event over time or at a specific time.
-
DistSurv("DistName") - calculates survival over continuous _time into the future.
-
DistSurv("DistName"; _time/12) - calculates survival over continuous _time into the future but converting the distribution in annual time to a time in months.
-
DistSurv("DistName"; 5) - calculates survival specifically at 5 time units into the future.
-
DistSurv(DistIndex) - all the above function forms but referencing the distribution by index without quotes instead of by name with quotes.
-
-
DistHazard: returns the risk of an event over time or at a specific time.
- DistHazard("DistName") - calculates event risk over continuous _time into the future.
-
DistHazard("DistName"; _time/12) - calculates event risk over continuous _time into the future but converting the distribution in annual time to a time in months.
-
DistHazard("DistName"; 5) - calculates event risk specifically at 5 time units into the future.
-
DistHazard(DistIndex) - all the above function forms but referencing the distribution by index without quotes instead of by name with quotes.
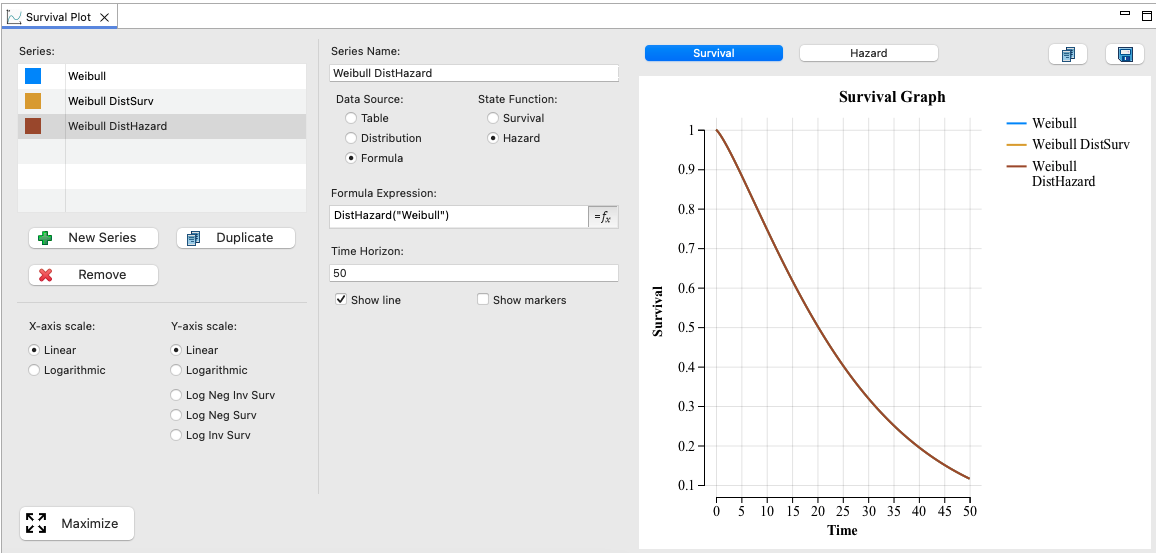
The Survival Plot View helps us see how these functions work using the Healthcare Example Model SurvivalPlot-Dist-Functions.trex. The Survival Plot includes three different series, but you only see one because all three generate identical survival curves and hazard functions.
Referencing the Weibull distribution directly equivalent to referencing the same distribution through the formula DistSurv("Weibull"). This is also equivalent to survival based on a Hazard function using the formula DistHazard("Weibull"). You can hide/show each series to see they all draw the same line.