47.3 Compound Curve Examples - Blends
This section focuses on examples of how a modeler could use Compound Curve Blends.
47.3.1 Blend Between Two Distributions
Survival analysis might identify two distributions that match well to your clinical data. However, extrapolation from those two distributions could result in significantly different long-term survival within the model.
The Example Model CC.5.SurvHaz_Blend_2Dist.trex includes three Compound Curves each of which blends two distributions together with the average survival providing your model's base case survival and the uncertainty bounds for survival represented by the two distributions themselves. All the Compound Curves use the same two Weibull distributions, but they differ as follows.
-
Blend_2Dist_Haz blends the two distributions based on hazards.
-
Blend_2Dist_Haz_M blends the two distributions based on hazards for Markov models.
-
Blend_2Dist_Surv blends the two distributions based on survival.
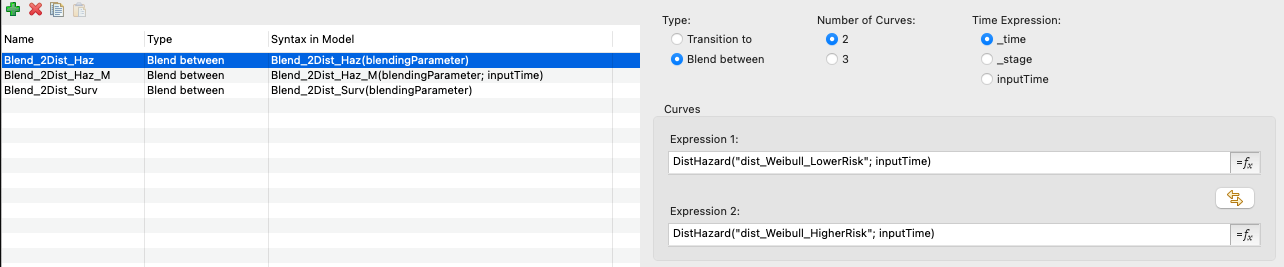
The PartSA hazard Compound Curve is shown above as Blend_2Dist_Haz; the others are similar.
The blendingParameter input to the Compound curve is represented by the variable surv_sensitivity defined as 1.5 with low and high bounds of 1 and 2, respectively.
The Survival Plot View below in Sensitivity Mode shows the hazard based Compound Curve used 3 times with different blendingParameter values. Given the blend has 2 curves the weight of the 2 hazard expressions is defined by that blendingParameter as follows:
-
blendingParameter/surv_sensitivity set to 1: fully weights the first hazard expression.
-
blendingParameter/surv_sensitivity set to 1.5: equally weights the two hazard expressions.
-
blendingParameter/surv_sensitivity set to 2: fully weights the second hazard expression.
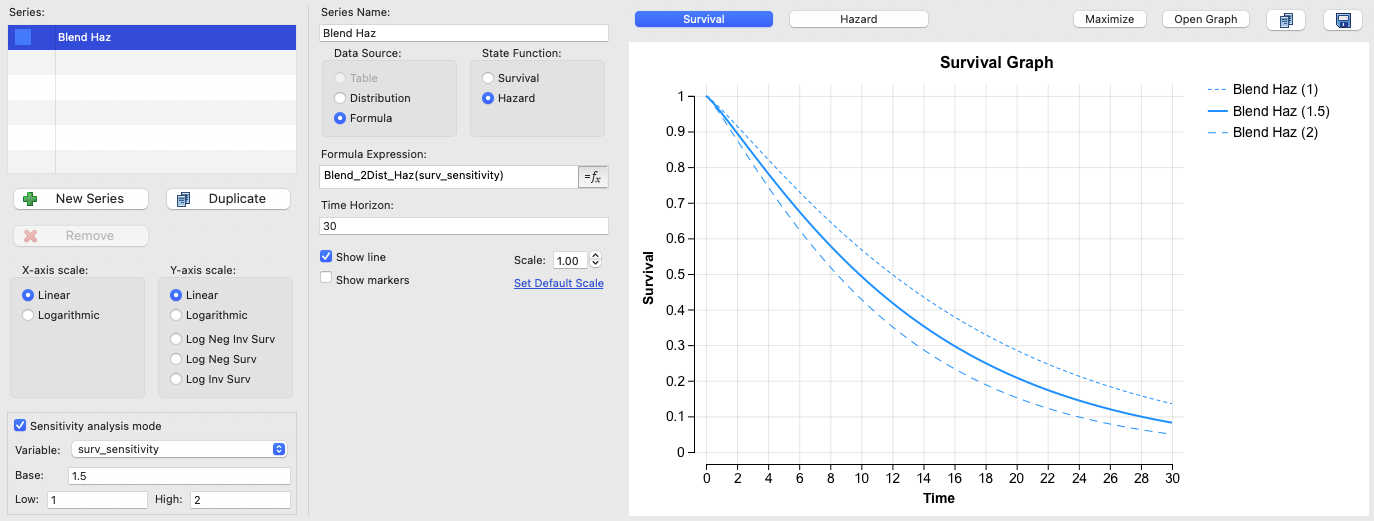
The model would use the middle (solid) 50/50 blend for the base case, but sensitivity analysis on the blendingParameter variable input surv_sensitivity accounts for survival uncertainty when running sensitivity analysis (via the two broken lines).
The model includes 2 strategies referencing Compound Curve blends - one strategy to show it in a Partitioned Survival Analysis model and the other in a Markov model. The Markov model uses the very similar Markov-based blend. You can see those in the Markov Plot using Sensitivity Analysis mode.
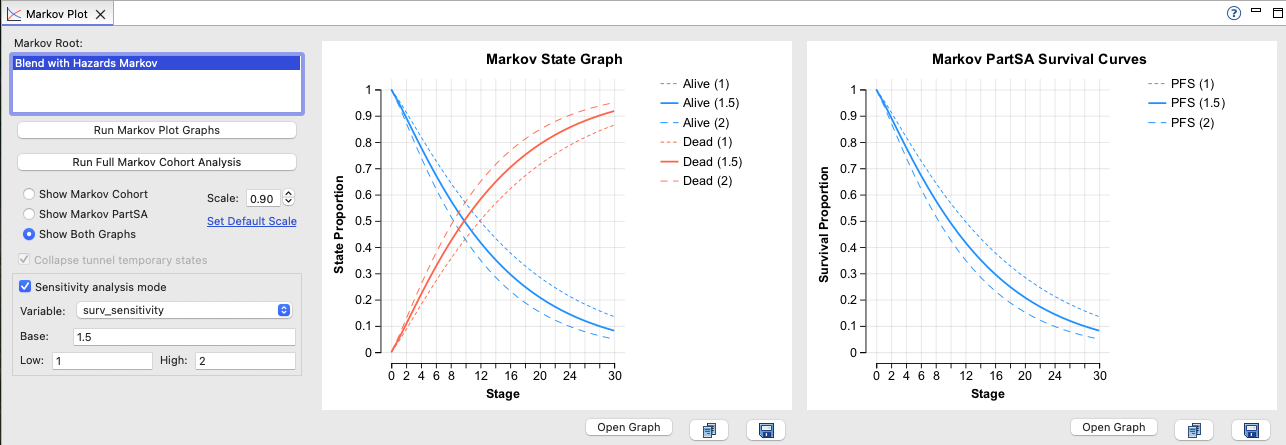
The solid lines show Markov model survival with the base case surv_sensitivity value of 1.5, while the two broken lines show the uncertainty range values of 1 and 2.
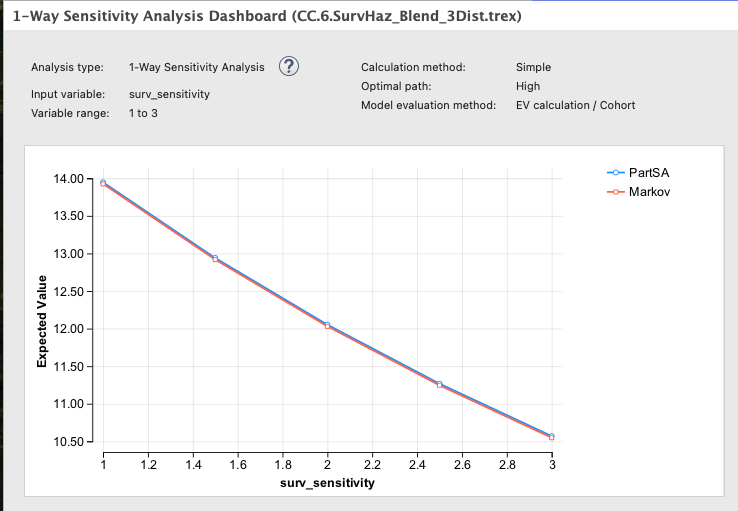
If we run Sensitivity Analysis on the variable input surv_sensitivity for both the PartSA and Markov strategies, we can see the difference in overall survival related to survival uncertainty.
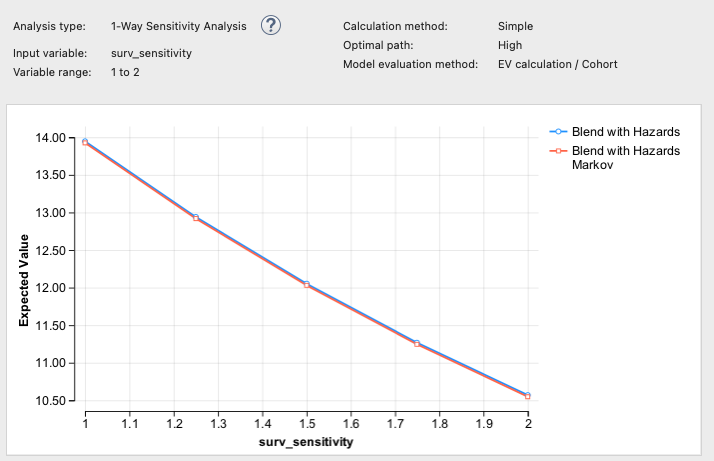
The sensitivity analysis shows the impact in the PartSA and Markov models is nearly identical.
47.3.2 Blend Among Three Distributions
This is a similar example to the section above, but it blends three distributions.
The Example Model CC.6.SurvHaz_Blend_3Dist.trex includes two Compound Curves each of which blends the three distributions together with the middle distribution providing your model's base case survival and the uncertainty bounds for survival represented by the top and bottom distributions. Both Compound Curves use the same three distributions, but they differ as follows.
-
Blend_3Dist_Haz blends the three distributions based on hazard.
-
Blend_3Dist_Surv blends the three distributions based on survival.
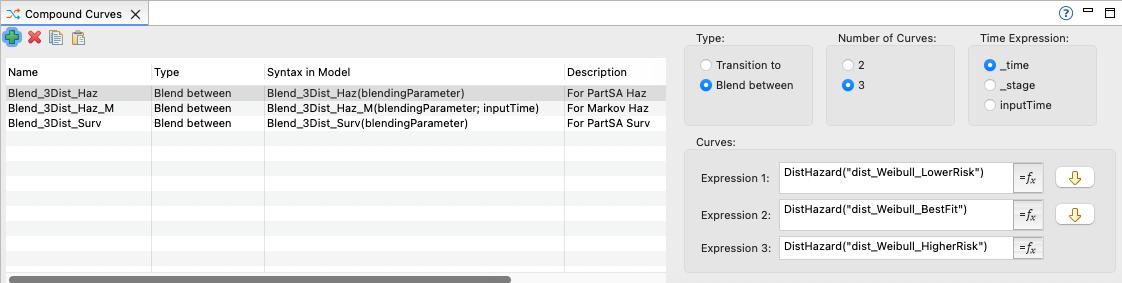
The PartSA hazard Compound Curve Blend_3Dist_Haz is shown above; the others are similar.
The Survival Plot View below in Sensitivity Mode shows the hazard based Compound Curve used 3 times with different blendingParameter values. Given the blend has 3 curves the weight of the hazard expressions is defined by that blendingParameter as follows:
-
blendingParameter set to 1: fully weights the first hazard expression.
-
blendingParameter set to 1.5: equally weights the first and second hazard expressions.
-
blendingParameter set to 2: fully weights the second hazard expression.
-
blendingParameter set to 2.5: equally weights the second and third hazard expressions.
-
blendingParameter set to 3: fully weights the third hazard expression.
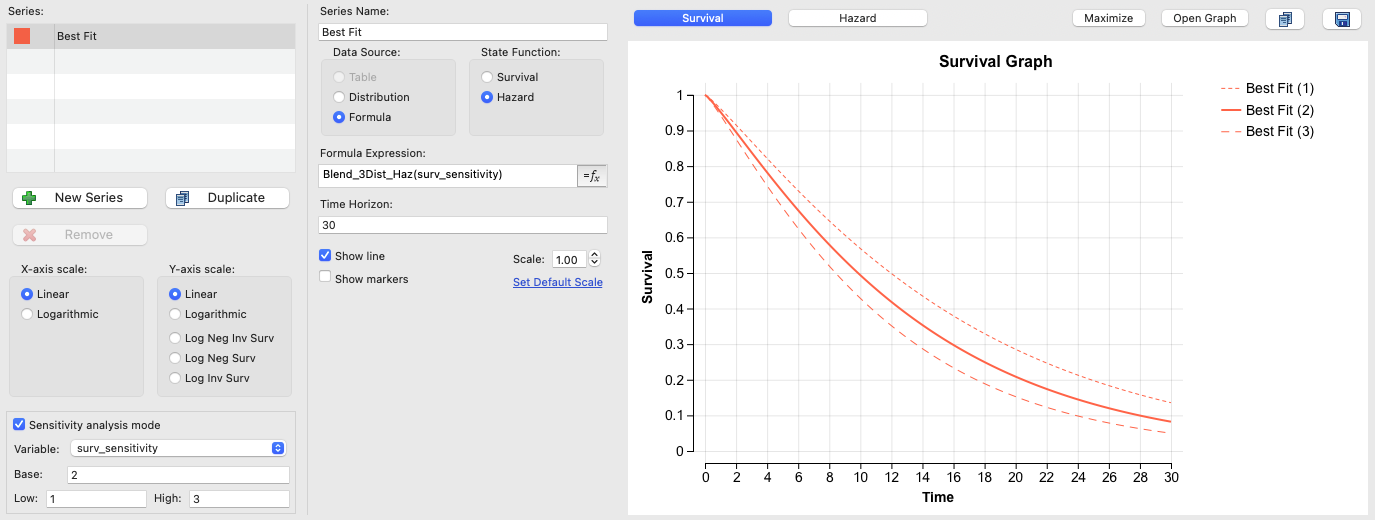
The model would likely use the middle red distribution for the base case, but sensitivity analysis on the blendingParameter variable input surv_sensitivity accounts for survival uncertainty when running sensitivity analysis.
If we run Sensitivity Analysis on the variable input surv_sensitivity on both strategies, we can see the difference in overall survival related to the survival uncertainty for both PartSA and Markov.