13.2 Distributions View
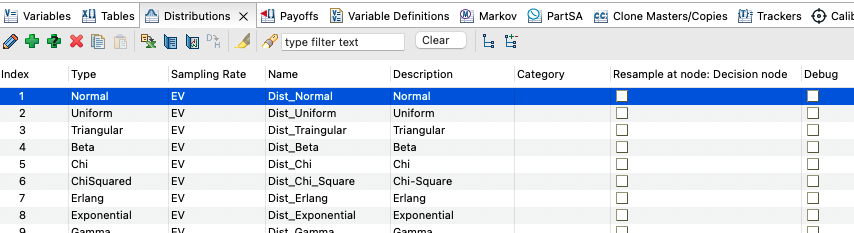
The Distribution View displays a list of all the distributions in the active model. Open the Special Features Example Model Distributions.trex to see a list of most of the available distribution types.
Double-click on any distribution to open it in the Add/Edit Distributions dialog.
The View columns include key information about each distribution like its type and sampling rate.
The resample at node text box automatically resamples the distributions for patients that reach that node, which you might use in DES models. Note that you select the appropriate node in the model first, then check the box.
The Debug node will output parameter calculations to the Calculation Trace console when debugging is set to output selected elements in the model.
The view's toolbar icons perform the following functions.
-
Pencil - edit the selected distribution.
-
+ : add a new distribution.
-
+? : add a number of new distributions.
-
X : delete the selected distribution.
-
Copy: copy the distribution row for pasting into the same or a different model.
-
Paste: paste a copied distribution into the model.
-
Excel: open the list of distributions in an Excel worksheet.
-
Report: generate a report that lists all the distributions in the model.
-
Graph It: generate a number of samples from the selected distribution and display those samples in a histogram. This is useful for testing/validating your distributions.
-
D>H: Show survival and hazards over time as represented by that distribution. The survival and hazards can then be exported to tables. This option is only available for distributions commonly used to plot survival (e.g., exponential, Weibull, generalized gamma, lognormal, etc.).
The highlighting, search, filter and category controls are the same as for other views like Variables.
