13.6 Distribution PDF and CDF options
When you create distributions, the Add/Change Distribution dialog displays the Probability Density Functions (PDF) and Cumulative Density Functions (CDF) graphs to visualize the shape of the distribution.
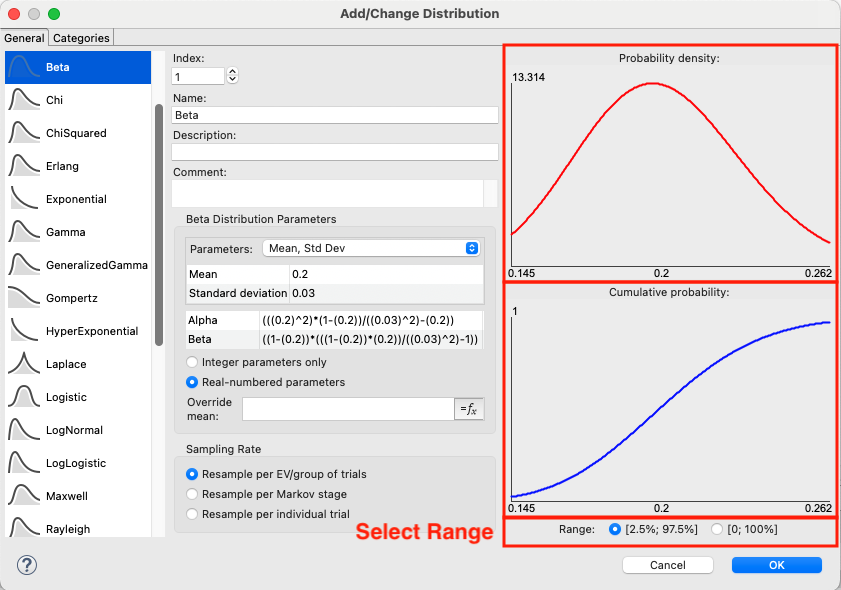
Distributions can have different domains, for example the Beta distribution domain is limited between 0 and 1, but presenting the [2.5%, 97.5%] portion of the domain provides better visibility into the shape of the distribution and the expected range of sampled values.
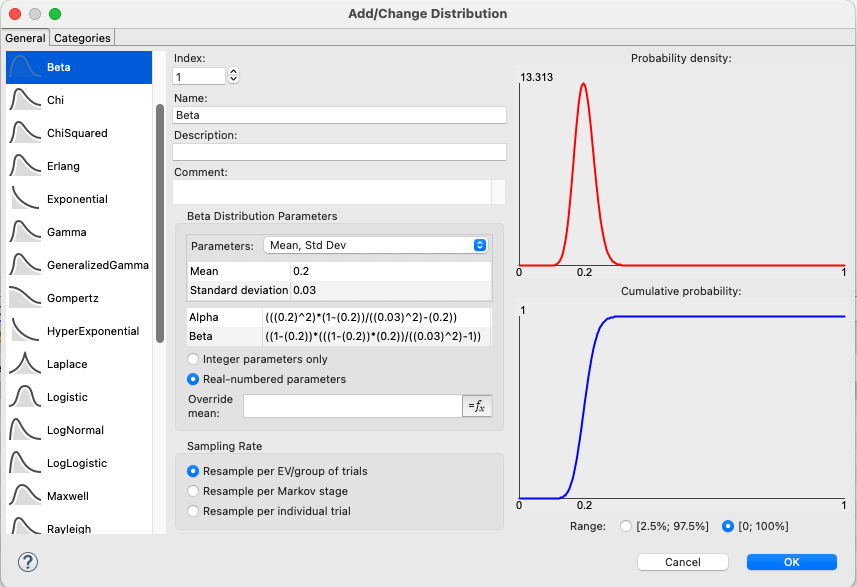
The image below show the full domain [0%-100%] full domain for the same Beta distribution. Note that it is more difficult to see the actual range of expected samples with this setting, so the [2.5%, 97.5%] subdomain (see above) is presented by default.
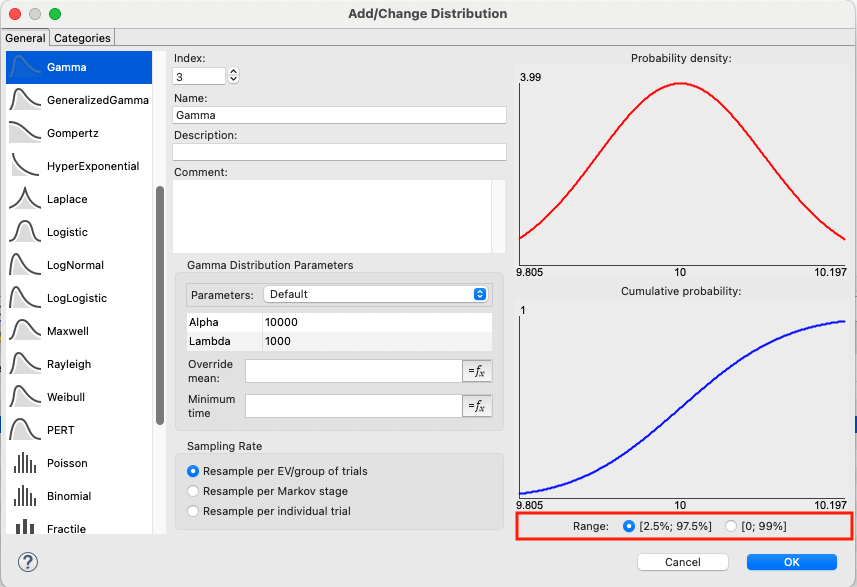
Other distribution types with infinite domains or positive infinite domains may also present a subset of the full distribution domain. Some distribution types will default to the entire domain while others will default to a subdomain based on best visualization. You can use the radio buttons to adjust the view of the PDF and CDF as desired.
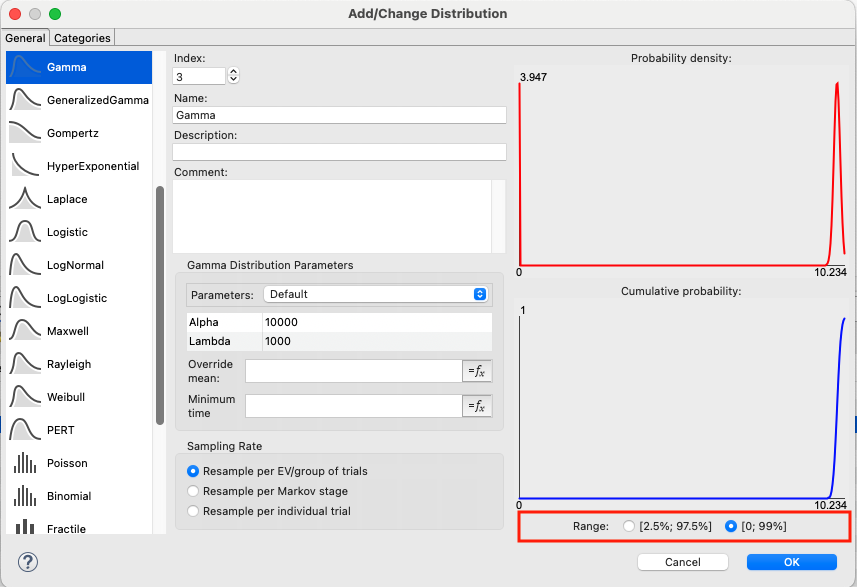
The images below show the different for a Gamma distribution where the default range is limited to [2.5% ; 97.5%] compared to the full range [0 ; 100% ]