14.1 Tables View
Tables are created and maintained via the Tables View.
To open the Tables View:
-
Choose Views > Tables from the toolbar.
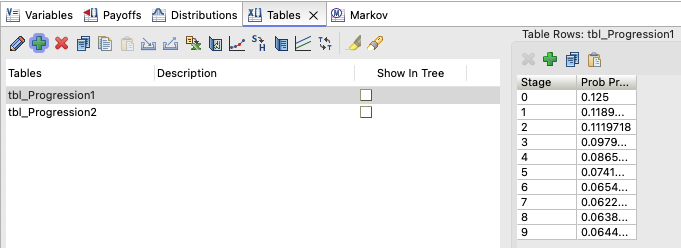
Within the Tables View, there are two sets of data and associated controls
-
List of tables and table controls to the left.
-
List of table entries and table entry controls to the right.
When a table is selected in the list, the table entry data and controls apply to that selected table.
The table property toolbar controls are described below from left to right.
-
Edit: Edit the selected table from the list.
-
Add: Create a new table.
-
Delete: Deleted the selected table(s) from the list.
-
Duplicate: Create a copy of the selected table and edit it as a new table.
-
Copy table: Select the row with the table(s) you wish to copy. Click the copy icon to copy the table(s) into the clipboard. The table(s) can then be pasted into the current model or a different model.
-
Paste table: Paste copied table(s) into the current model.
-
Import: Import table(s) from a global table file (*.tblx) into the model.
-
Export: Export table(s) from the model to a global table file.
-
To Excel: Copy the selected table and its data to Excel for editing.
-
Graph It: Create a graph from the selected table's data. Note that you can select multiple tables and graph them together.
-
Edit Hazard Table Graphically: Edit a table in the Hazard Table Editor, which shows the related impact on survival.
-
Convert Survival to Hazard Table: Convert a survival table to a hazard table to represent a health risk over time.
-
Report: Create the Tables Used Report which displays all the tables that exist and/or are referenced in the tree. The "Unused" column indicates that a table exists in the tree but is never referenced. The "Missing" column indicates that a table is referenced in the tree, but does not exist.
-
Hazard Proportionality Graph: Open a Survival Plot graph to compare two or more survival tables to visualize whether the hazards are proportional.
-
Convert Table: Convert a table between different types including Probability (Mortality) Table to Cumulative Probability Table.
-
Highlight: Highlight the table within the model in the Tree Diagram Editor.
-
Find references in tree: This will find where the highlighted table is referenced
The table data toolbar controls are described below from left to right.
-
Delete: Delete the selected table entries from the table.
-
Add: Add a new table entry to the table.
-
Copy: Copy table data with headers and rows to clipboard.
-
Paste: Paste table data with headers and rows from clipboard to table. Existing data is replaced.
