14.5 Fitting a Distribution to a Survival Table
Modelers frequently fit distributions to clinical survival data to model disease progression. While clinical Kaplan-Meier tables are valuable source data, they are static, jumpy and they often to not extend out to the model time horizon. A fitted distribution will smooth out survival and provide a basis for extrapolation into the future for use in Markov and Partitioned Survival models.
In this section, we will use Healthcare Example Model Fit Distribution to Table.trex to demonstrate this function.
This model includes a table KM_OS which represents overall survival for a treatment group.
-
Open the Tables View.
-
Select the table KM_OS.
-
Click the third toolbar icon Fit Distribution to a table.
The following dialog opens for the distribution fitting function.
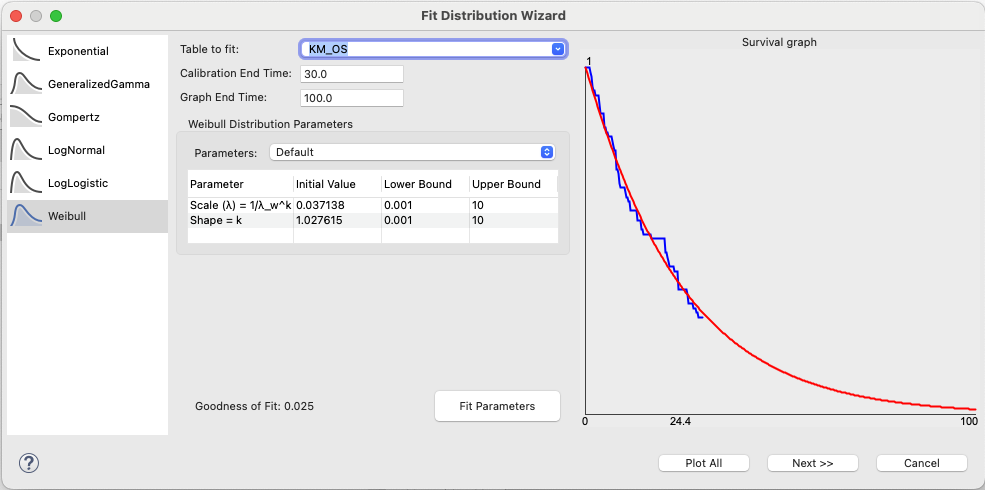
The graph to the right shows the original table in blue along with survival derived from a fitted Weibull distribution in red. You can change the distribution type to fit other distributions to the same survival table data. Occasionally, you may need to click Fit Parameters if TreeAge Pro does not find a good fit on the first attempt.
-
Click Next >>, and the Add/Edit Distribution dialog will open with the distribution type and parameters from the fit screen.
-
Change the name as desired, and click OK to create the new distribution. It can then be used in Markov, Partitioned Survival, and Discrete Event Simulation models for disease progression.
-
If you click Plot All, this will plot all the distributions in a new model. The new model can then be reviewed for comparison and this is covered at the end of this section.
The model Fit Distribution to Table.trex already contains six distributions: three from R regression and three from TreeAge Pro fitting. The parameters are similar between the two approaches. Open the Survival Plot to see the KM table and all 6 fitted distributions plotted.
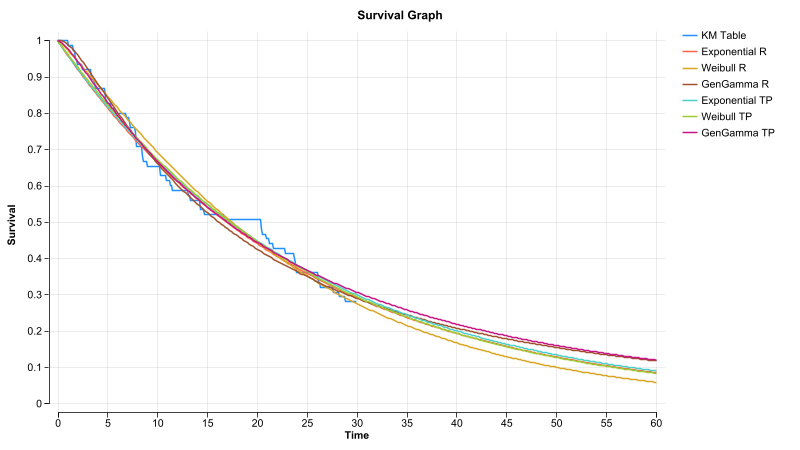
Any of these distributions could be used to drive disease progression in the model. The model is set up as a simple, single-survival-curve Partitioned Survival model using the TreeAge Pro–fitted Weibull distribution (dist_index = 4), but you can run sensitivity analysis on dist_index to see the range of survival (LY) across all six fitted distributions.
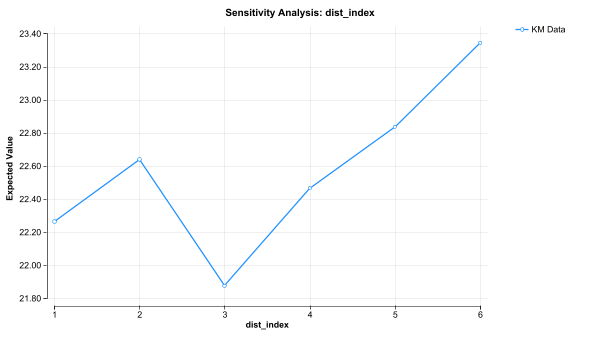
In order as per dist_index...
-
Exponential from R
-
Exponential from TreeAge Pro
-
Weibull from R
-
Weibull from TreeAge Pro
-
Generalized Gamma from R
-
Generalized Gamma from TreeAge Pro
14.5.1 Plotting All Fitted Distributions
You can Plot All fitted distributions in a new model to compare them. After selecting the table in the Fit Distributions Wizard dialog, click Plot All. This creates a new model that includes the table and all fitted distributions.
The table and distributions are automatically added to the Survival Plot, allowing you to compare the fits and assess how they extrapolate beyond the table data.
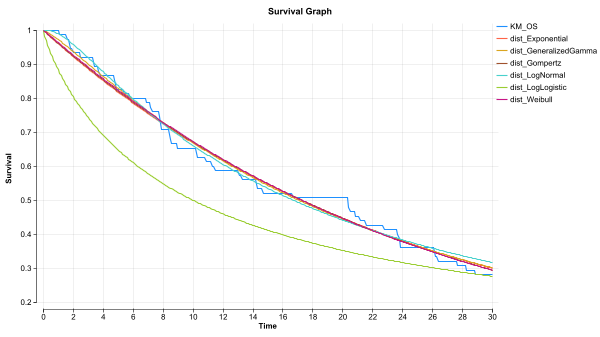
They are all placed in a new model because you may not want all of the distributions in your own model. Just copy and paste any you need into your working model.