36.3 Reporting - Dynamic Cohort Analysis
Typical Markov models use a cohort size of 1 and present state and event membership as a percentage of the cohort. Dynamic Cohort models with non-coherent probabilities instead present full cohort counts rather than percentages in their report output. These different views of the cohort (percentage vs. counts) feeds directly into Cost Effectiveness reporting.
Consider the Healthcare tutorial example tree, Dynamic Cohort - Markov Cancer.trex, select the Markov node Tx 1 and then generate the Markov Cohort Extended Report.
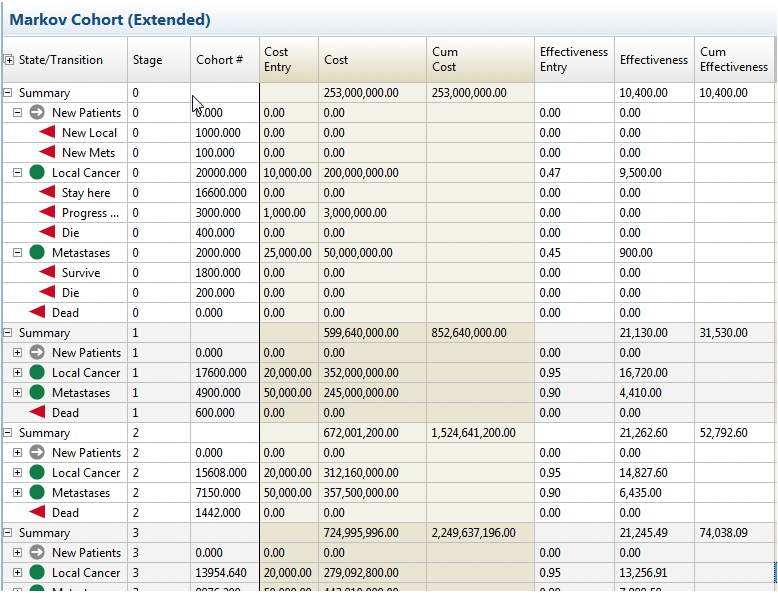
There are several features of this report to examine:
-
The Entry Node, New Patients, adds 1000 to Local Cancer and 100 to Metastases at each cycle. At stage 0 (and all subsequent stages) we can see this number in the Cohort # column. Those additions will show up in the regular health states in the following cycle.
-
There is no cost or effectiveness associated with the Entry node because this is only a mechanism for creating individuals for the model.
-
The Cohort column is now recording actual numbers rather than proportions of the cohort. This means that total costs and effectiveness are going to be significantly higher.
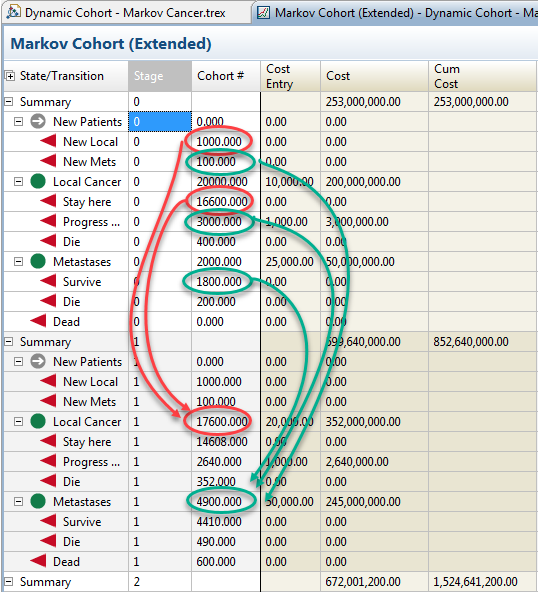
The figure below shows how the Entry node adds New Patients to the different Health states.
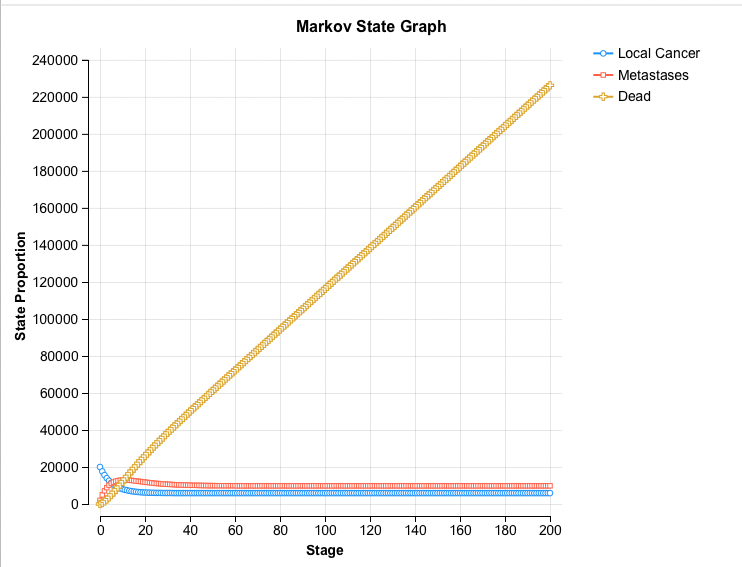
The Charts generated for a Dynamic Cohort are also different because of the size of the cohort we are considering.
State Prob Curve
The State Prob curve uses actual population counts. The vertical axis is the Count and in this instance we can see how the number Dead dominates the graph, as in the figure below.
Other graphs are also based on the total values, for example the total costs for the population rather than the average value for an individual.
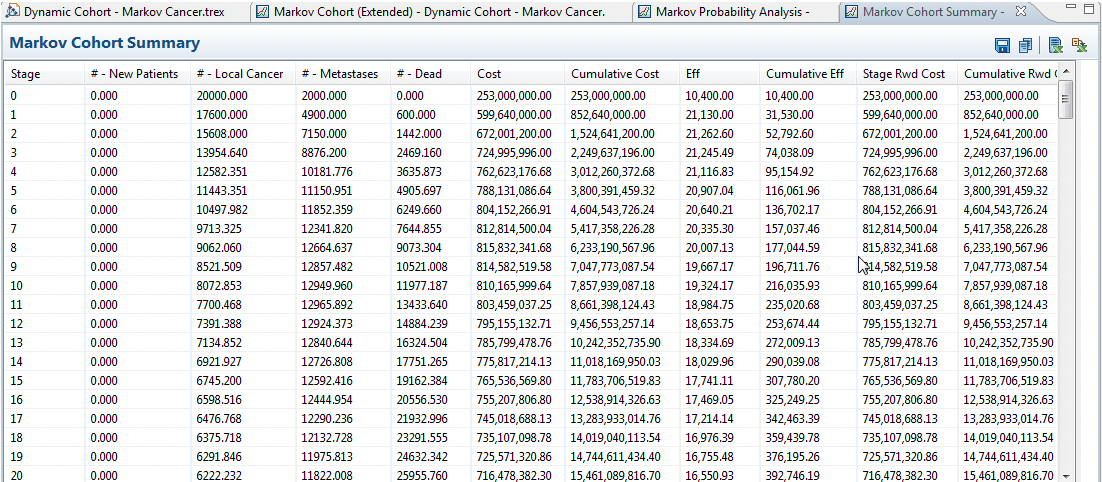
The Summary Report will give a tabular set of results showing the total population number in each Health State.
The model we are examining is a decision tree, so we can also generate Cost Effectiveness Analysis. In the Dynamic Cohort - Markov Cancer example model, select the root node and then run the Rankings Report.
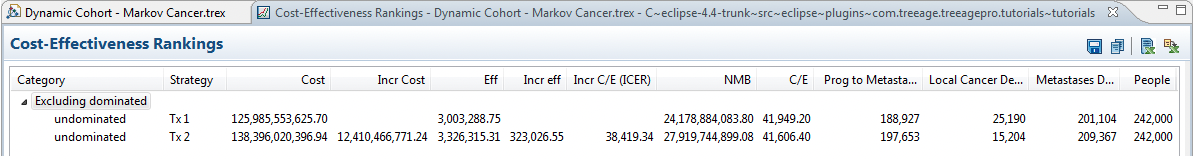
The report has very large numbers for cost and effectiveness because it is considering the whole cohort's cost and effectiveness. Because both strategies (Tx1 and Tx 2) are accumulating rewards for the whole cohort, it is valid to consider the Incremental Cost and Effectiveness and generate the ICER. In this example, the ICER is 38,419 and based on a Willingness to Pay of $50,000 we conclude that Tx 2 is the optimal strategy.
