6.9 Markov Calc Plot
Markov models frequently have values that change over time. The Markov Calc Plot allows you to visualize any values that change over time with each Markov cycle (i.e. by _stage). The separate Markov Plot visualizes the cohort analysis and can compare with survival tables.
We will use healthcare example model Three-State Markov-Time.trex to demonstrate the Markov Calc Plot. Click here to see how the time-dependent value was added to this model.
To use the Markov Calc Plot View:
-
Open example model Three-State Markov-Time.trex.
-
Open the Markov Calc Plot View from the Views drop-down list in the toolbar.
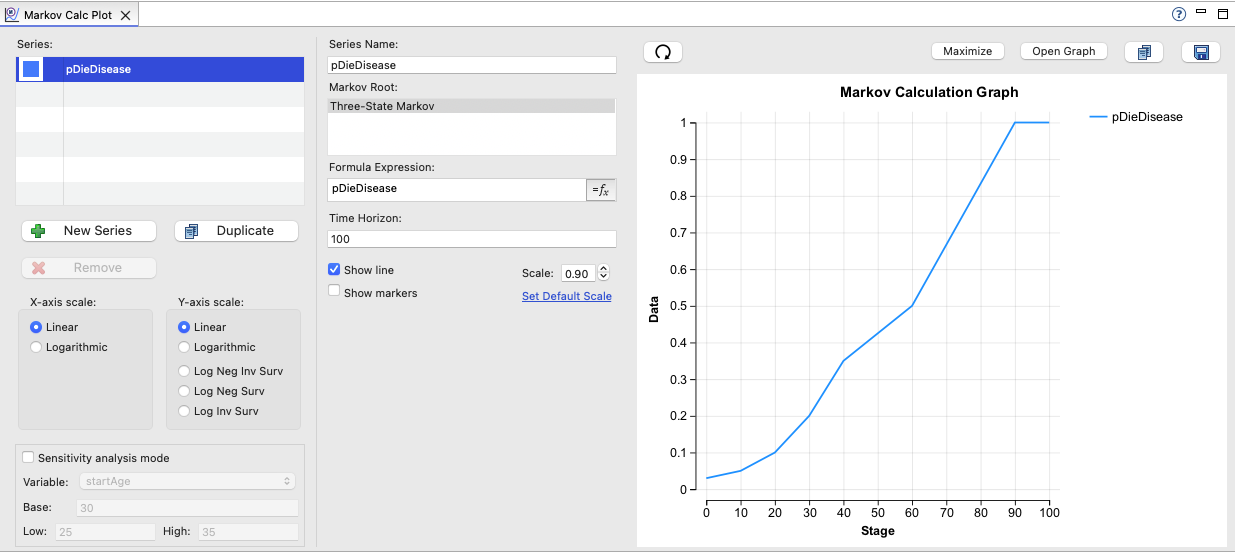
The one series shown in the plot is for the variable pDieDisease.In the Variables View you can see that pDieDisease is defined by the formula tMort[currentAge] which indirectly references the cycle counter keyword _stage through the variable currentAge = startAge + _stage. Therefore, as Markov time passes and _stage is updated, the value of pDieDisease changes as seen in the graph.
Controls within the Markov Calc Plot view provide additional functionality to help you validate your time-based calculations.
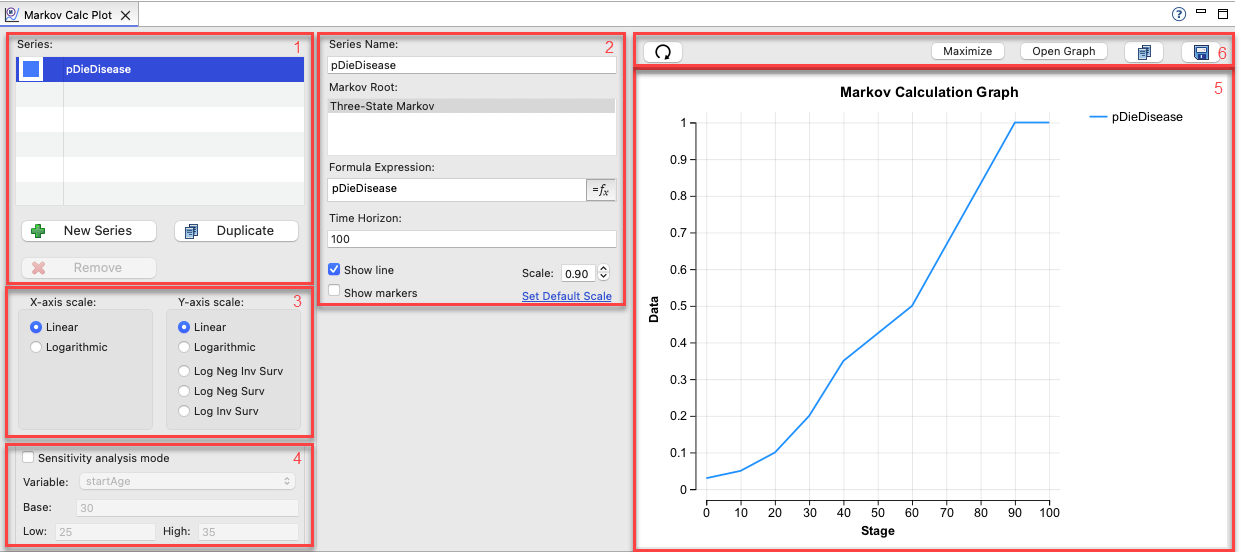
The controls in each numbered box are described below.
-
Series List:
-
The Markov Calc Plot View can plot multiple calculations. Use these controls ("New Series", "Duplicate", "Remove") to add and remove series from the graph.
-
-
Series Definition:
-
Allows you to setup the series selected in the list above.
-
Name: Used for the legend in the graph.
-
Markov root: Select the specific Markov process within the model where the series should be evaluated.
-
Formula Expression: Set the specific calculation to be plotted.
-
Time Horizon: Set the time limit for how long the series should be plotted (how many cycles).
-
Show line/markers: Change the graphical formatting of that series within the plot.
-
Scale: Change the graph scale for all series.
-
-
Graph scale:
-
Change the scale options of the x-axis and y-axis.
-
-
Sensitivity Analysis Mode:
-
Show the series as 3 lines based on the base case and low/high values for an uncertain variable that impacts one or more series.
-
-
Graph:
-
Plots the series over time as _stage increments.
-
-
Graph controls:
-
Refresh the graph (if changes have been made that could affect the series).
-
Maximize: Expand the Markov Calc Plot to full screen.
-
Open Graph: Open the graph as a separate window to allow for additional formatting options.
-
Copy: Copy the graph into the clipboard for pasting into documents.
-
Save: Save the graph as an image file.
-