Communicate using Familiar Reports
Share your outcomes and reports easily across multiple platforms
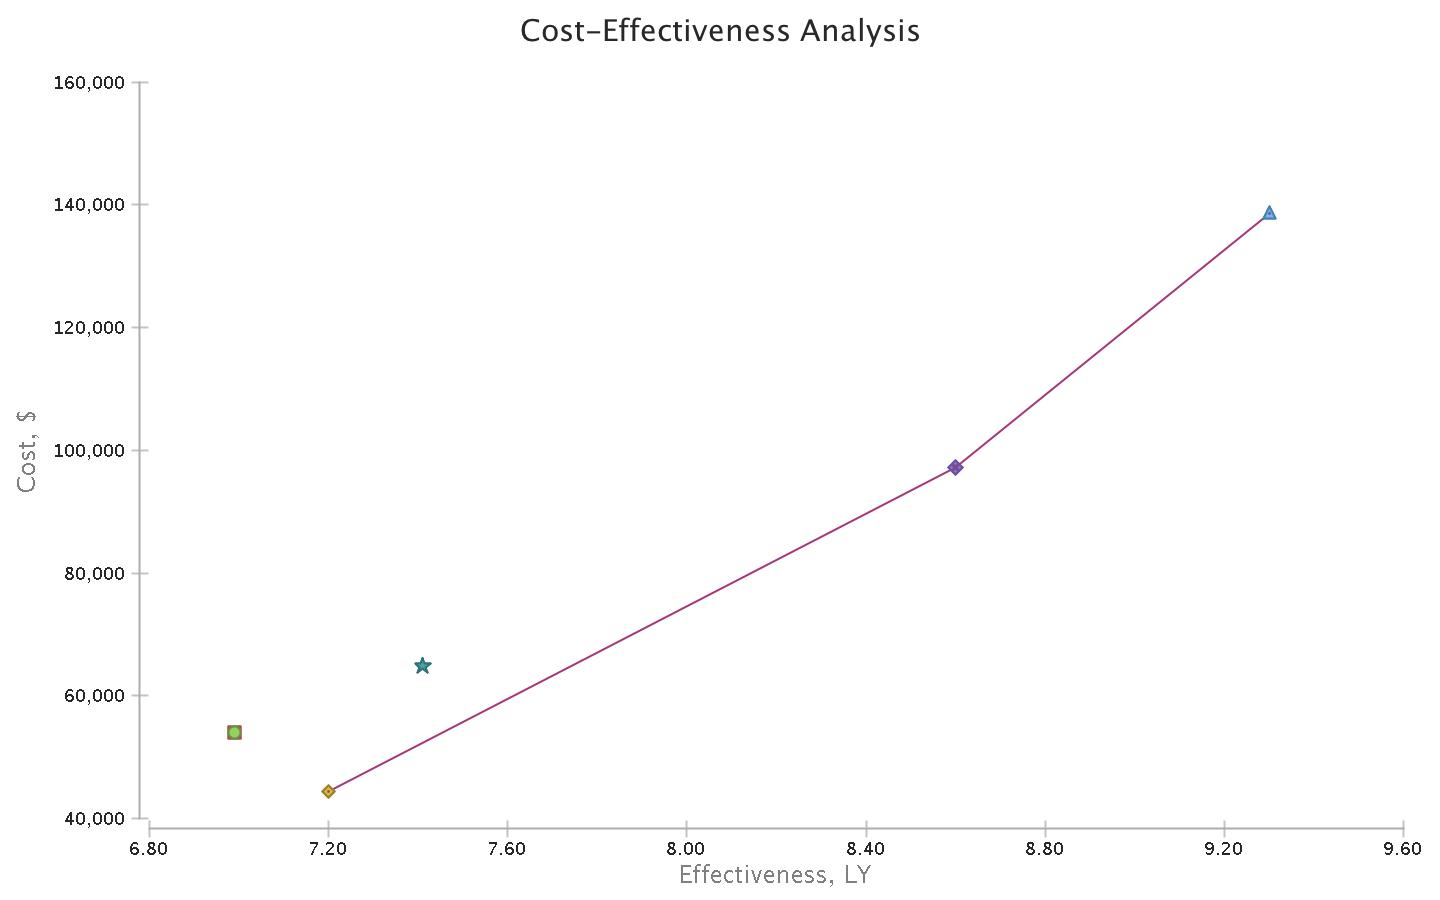
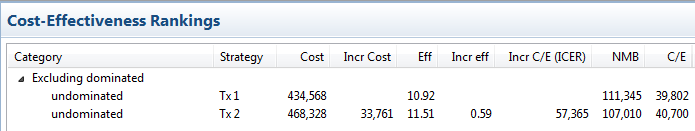
Built-in Healthcare Reports
- Cost-Effectiveness Analysis
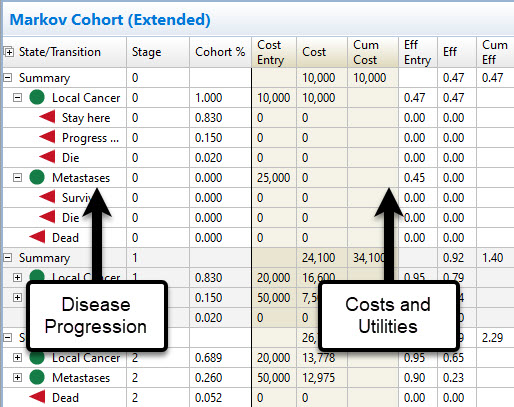
- Markov Cohort Analysis
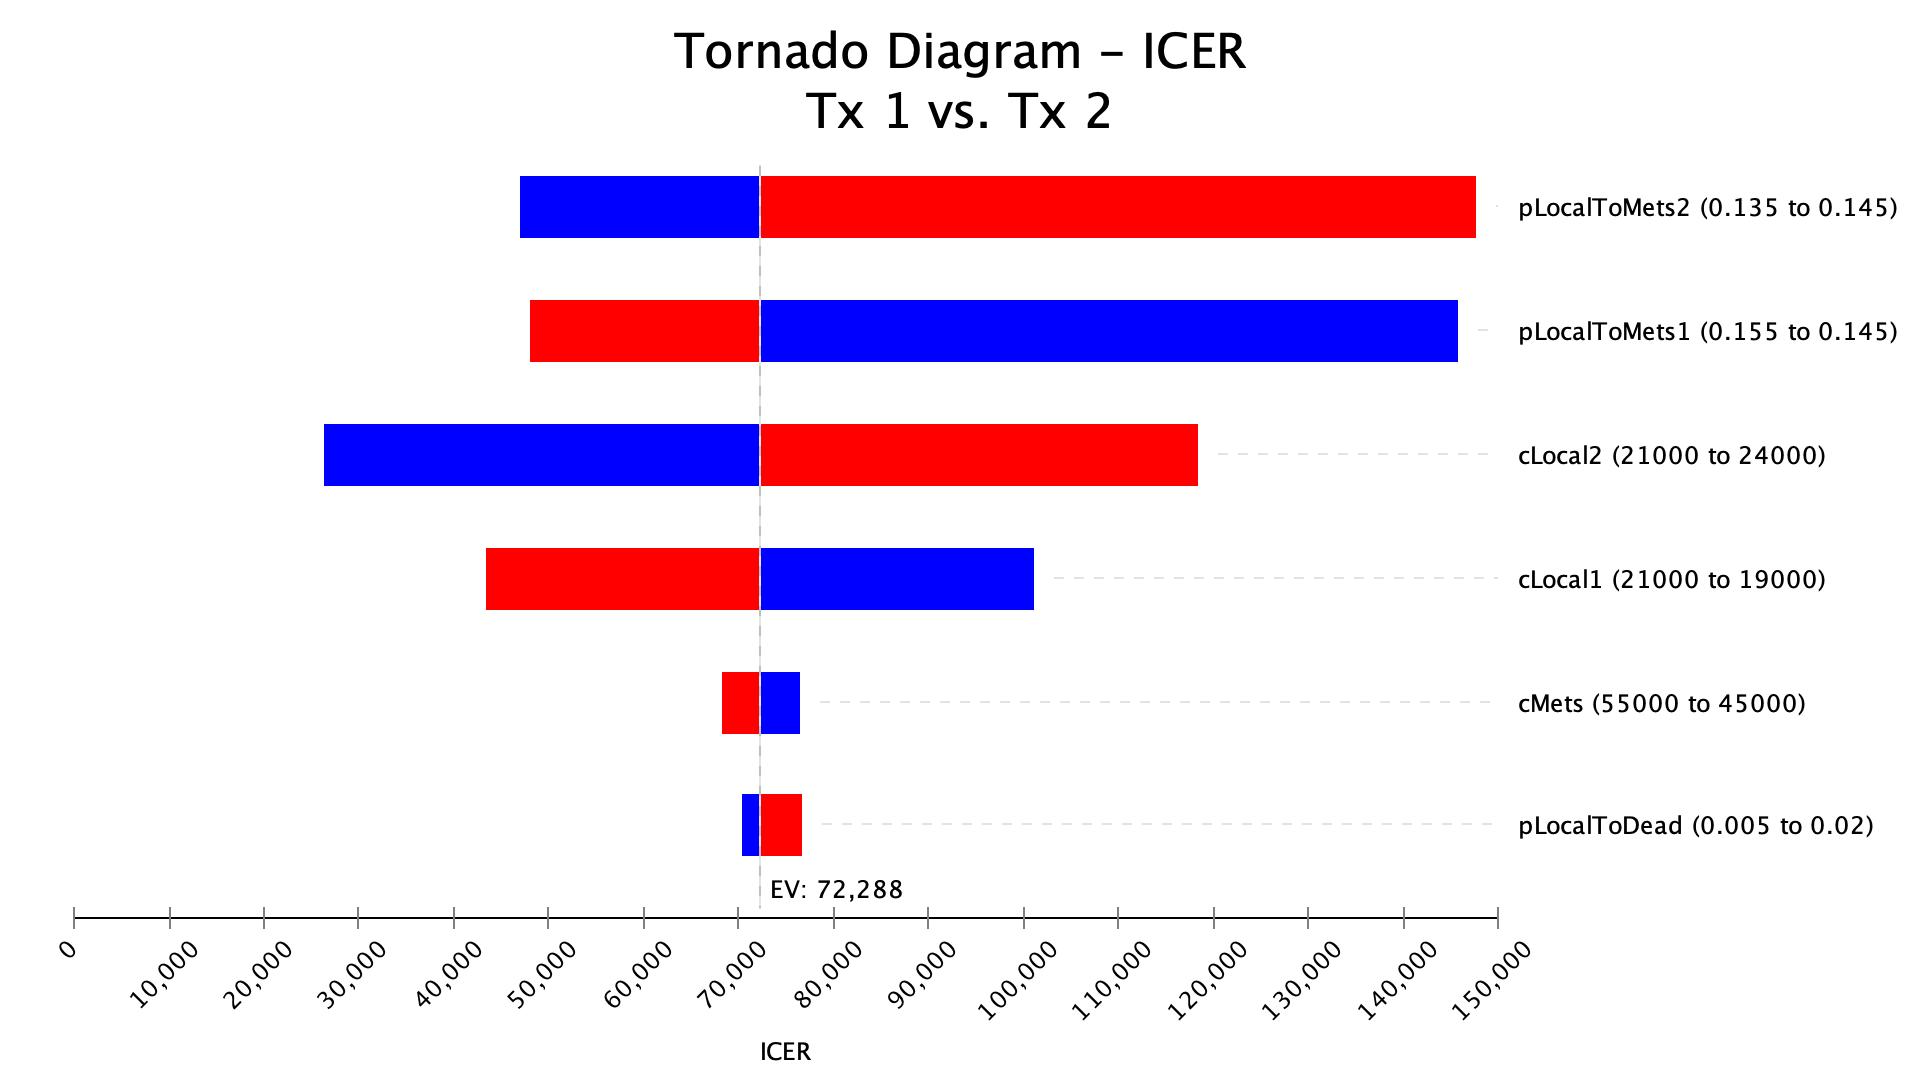
- Tornado Diagrams
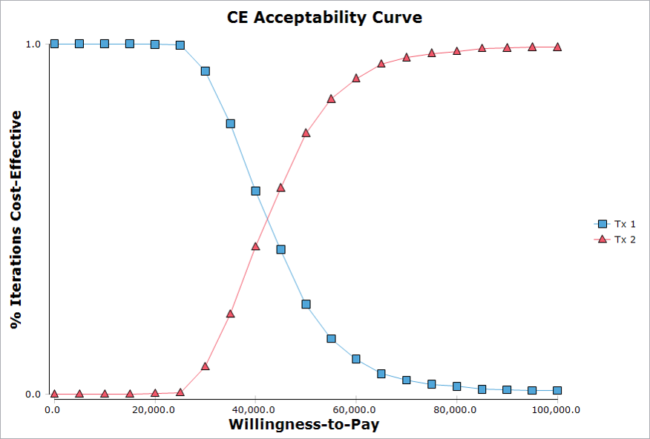
- Cost-Effectiveness Acceptability Curves
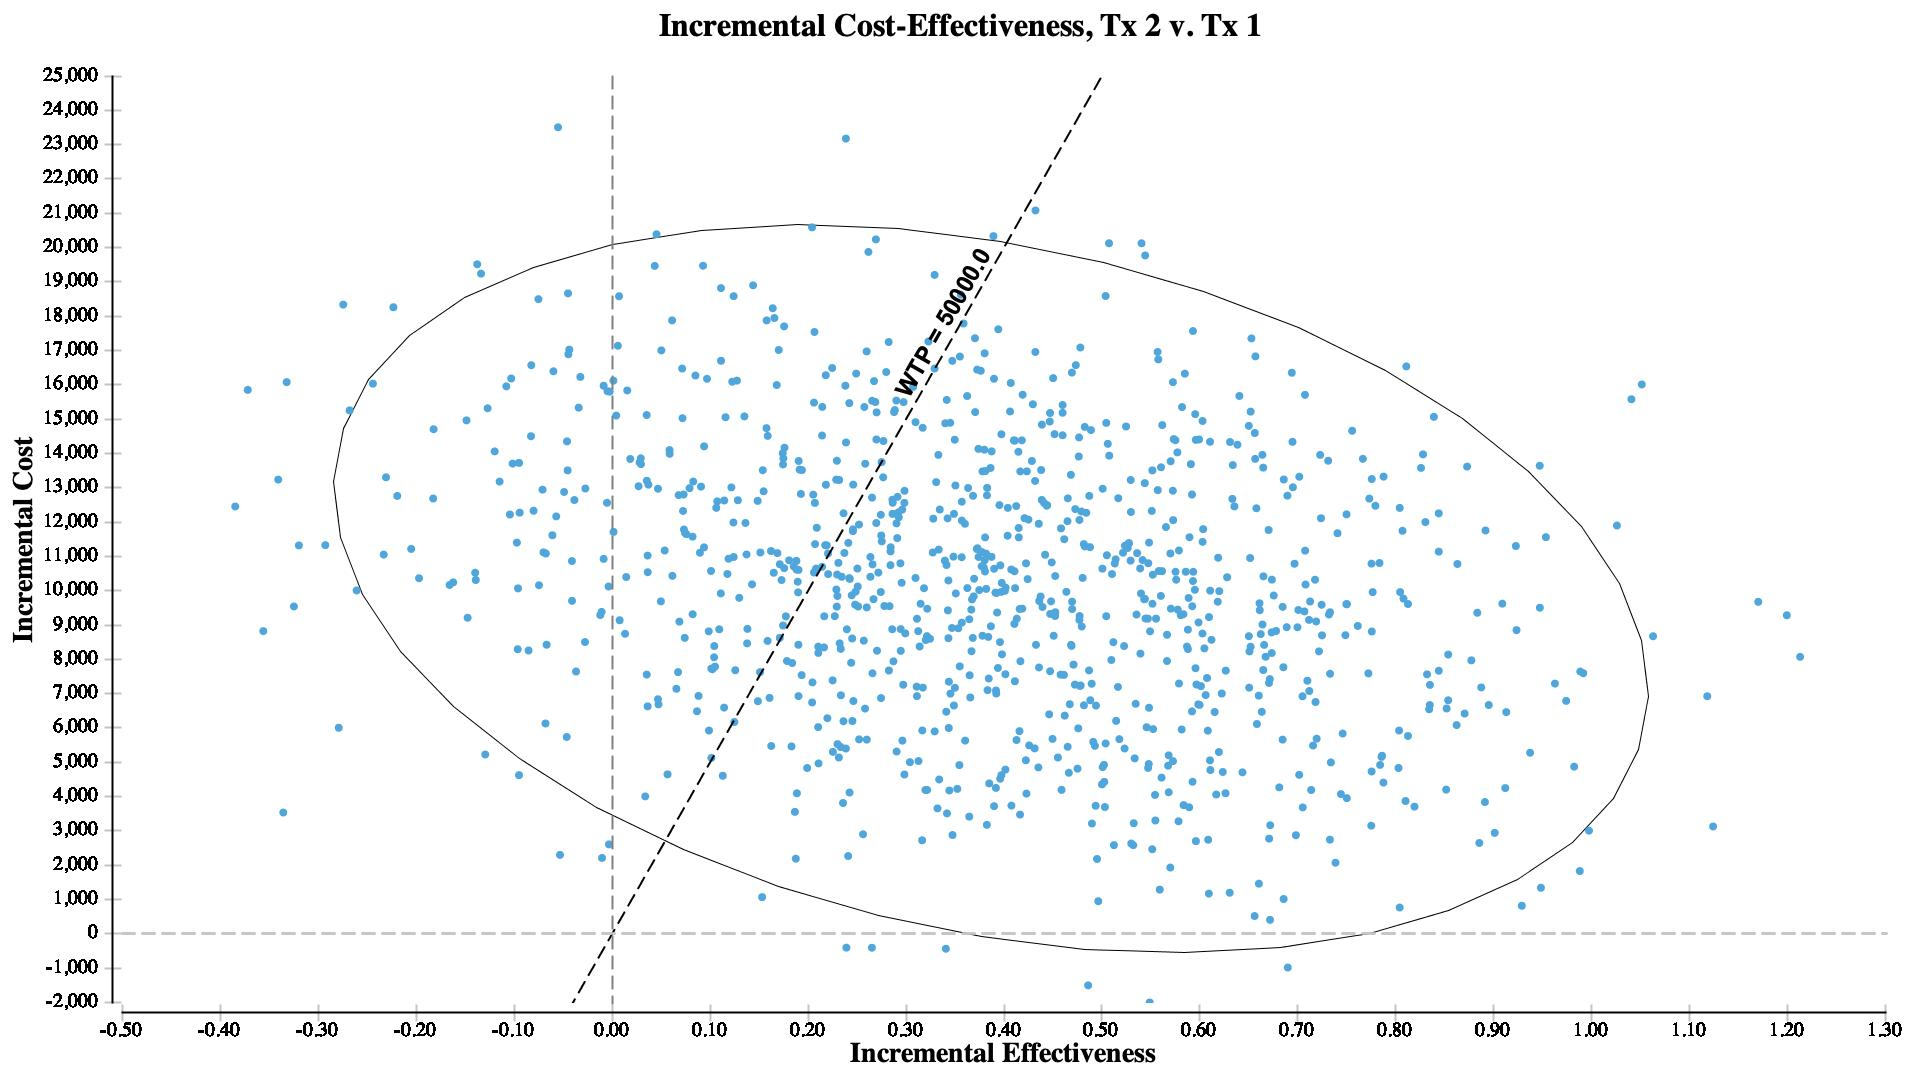
- ICE Scatterplots
- and so much more
Paste graphs directly into your documents.
Explore Model Scenarios in Excel
Share results from any model in Excel for easy distribution. Vary inputs in Excel to see the impact on results.

Review Cohort Flows for Markov and Simulation models
See how patients flow through the model and accumulate cost and utility.