This release is highlighted by Compound Curves, TPWeb PartSA & PSA and Plotting Proportional Hazard.
TreeAge Pro Healthcare
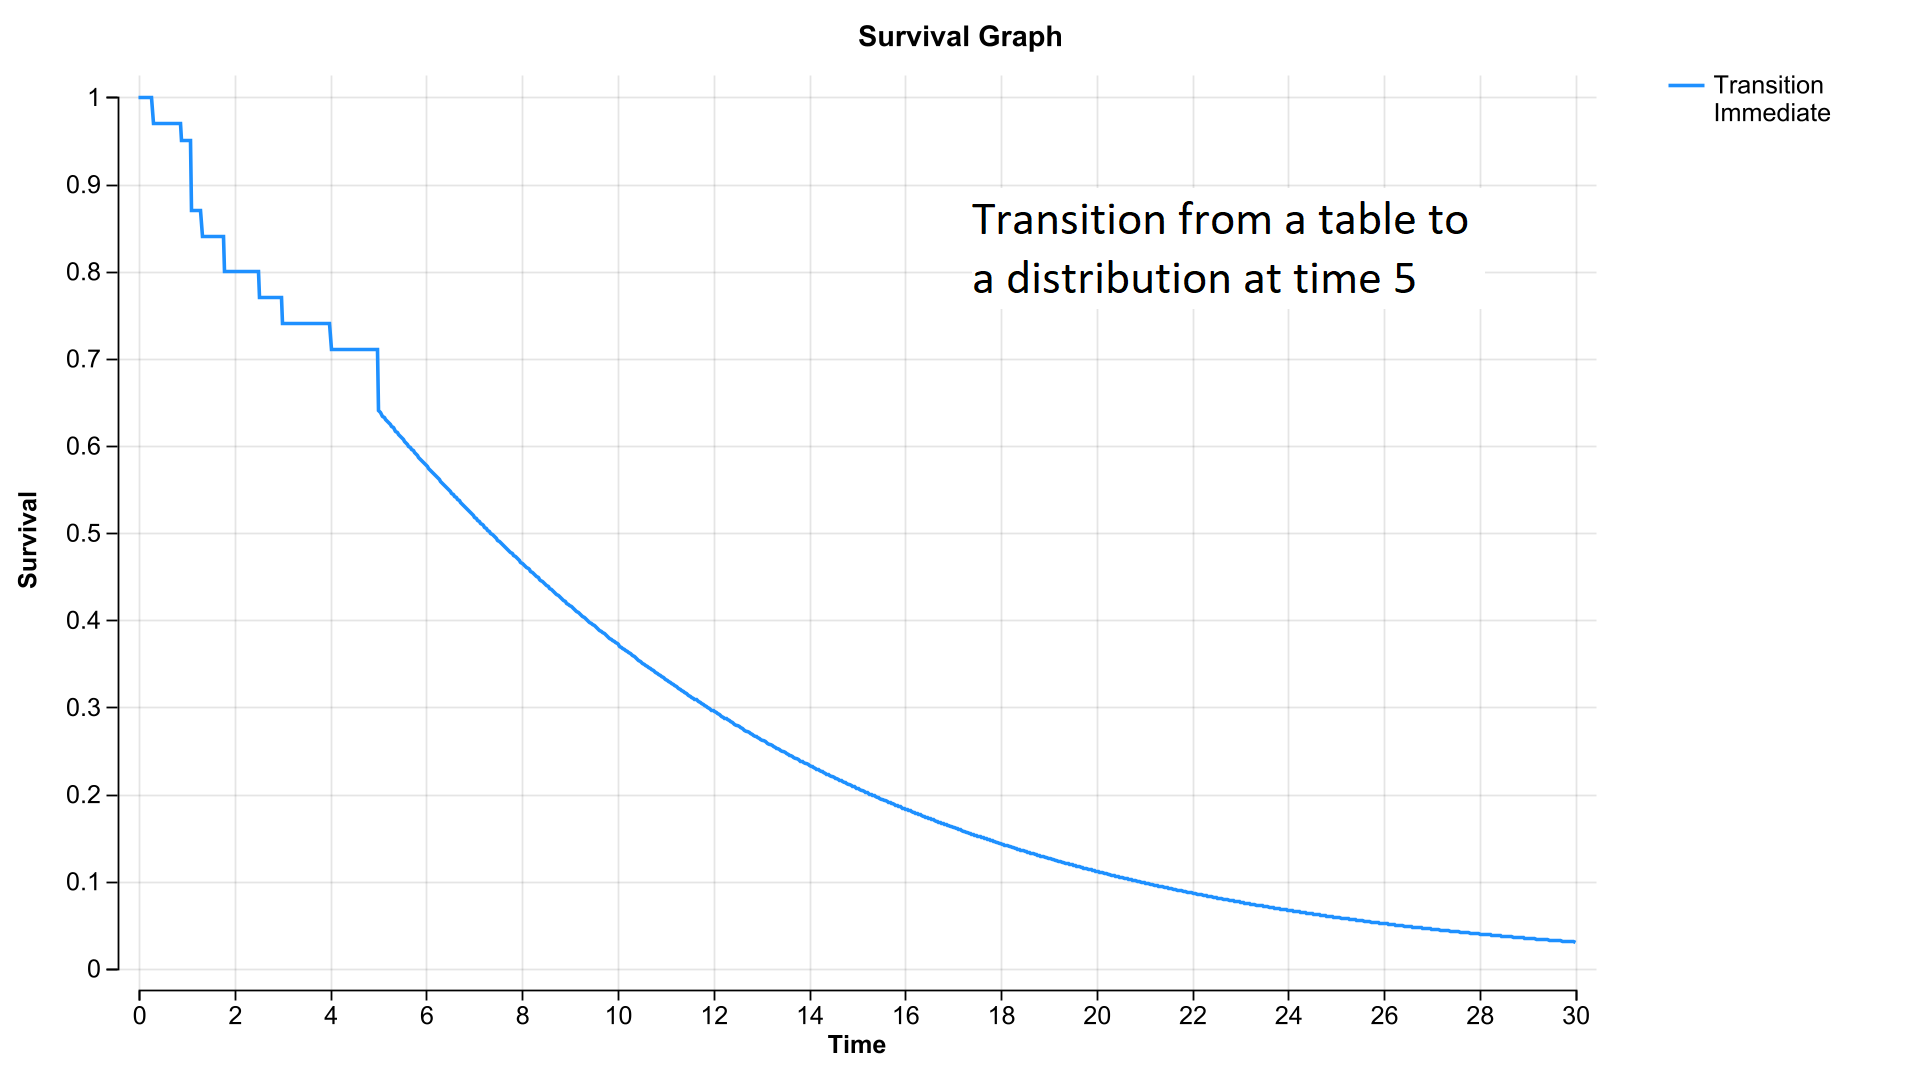
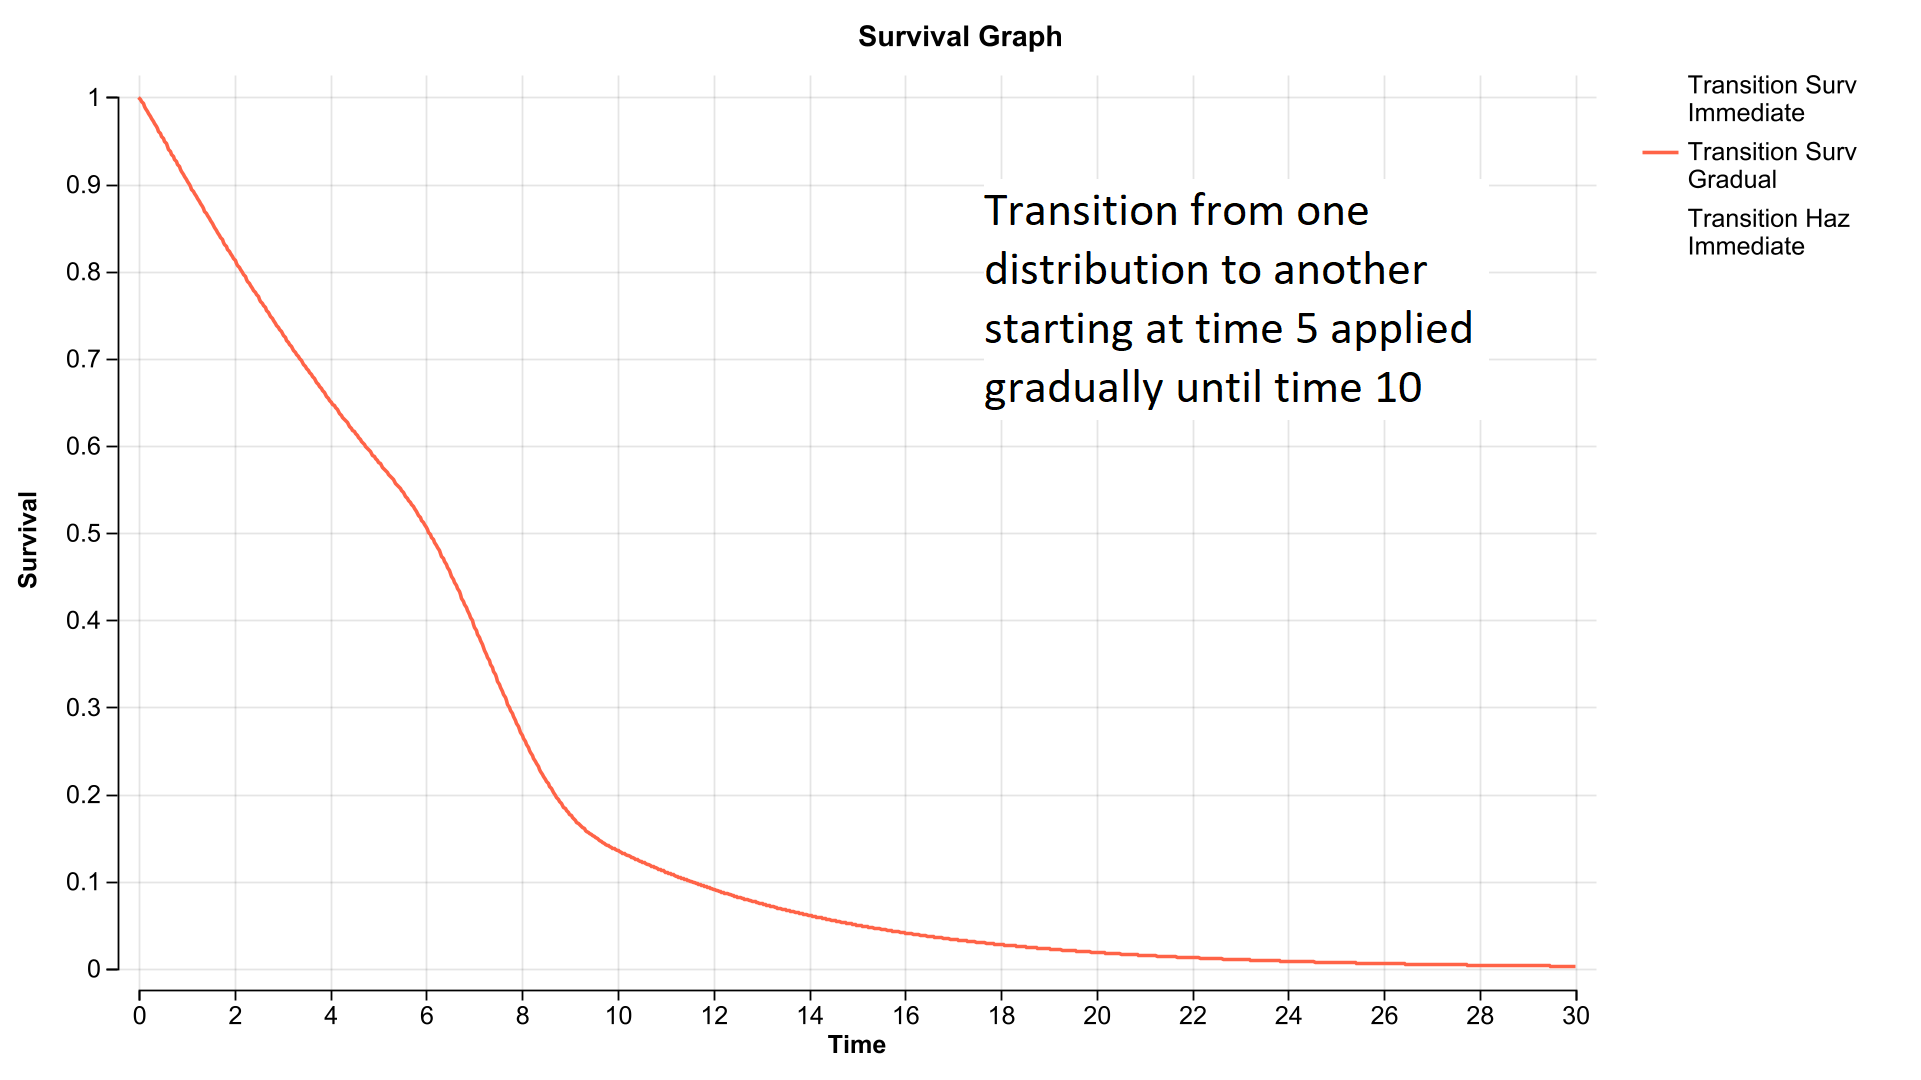
- Combine Survival/Hazard Estimates *
- Combine multiple estimates of survival or hazard into a single curve.
- Transition from one estimate to another to form a single survival or hazard curve.
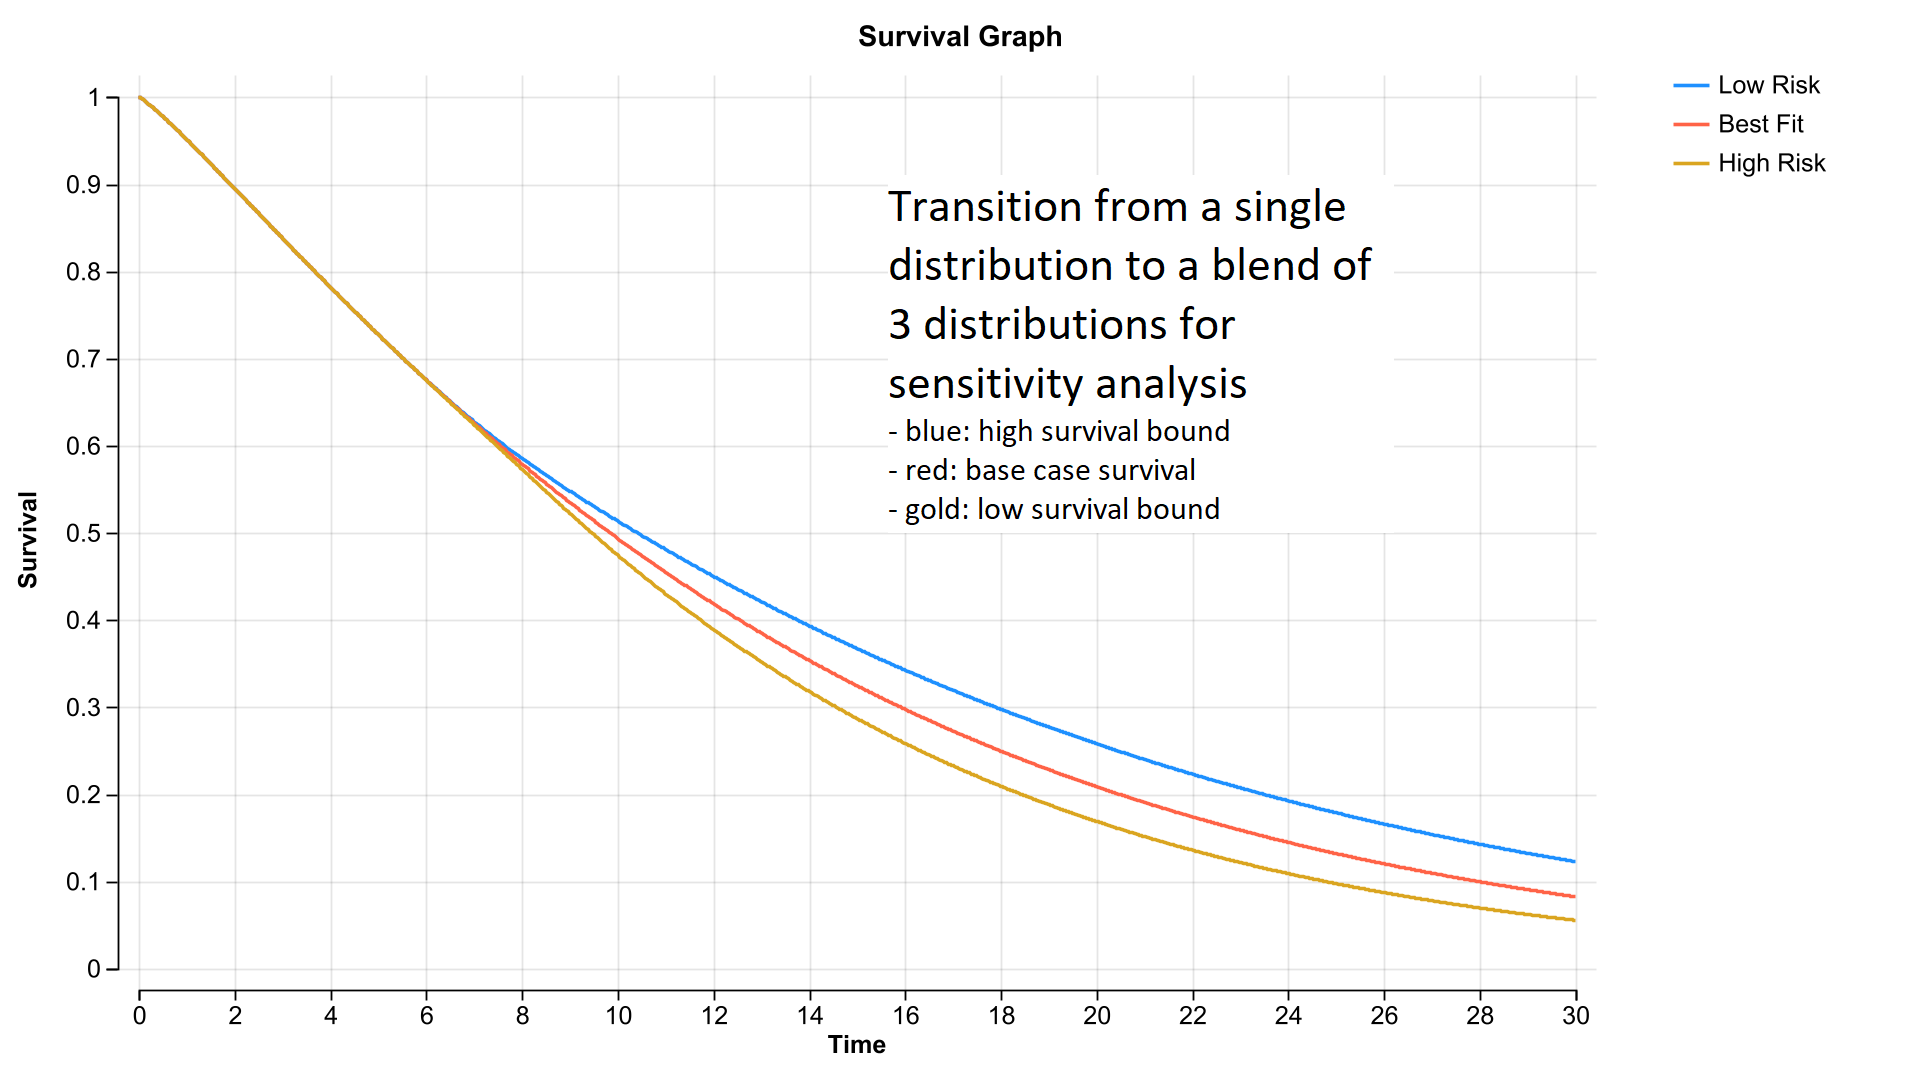
- Blend multiple estimates over the same time period to represent low and high bounds for sensitivity analysis.
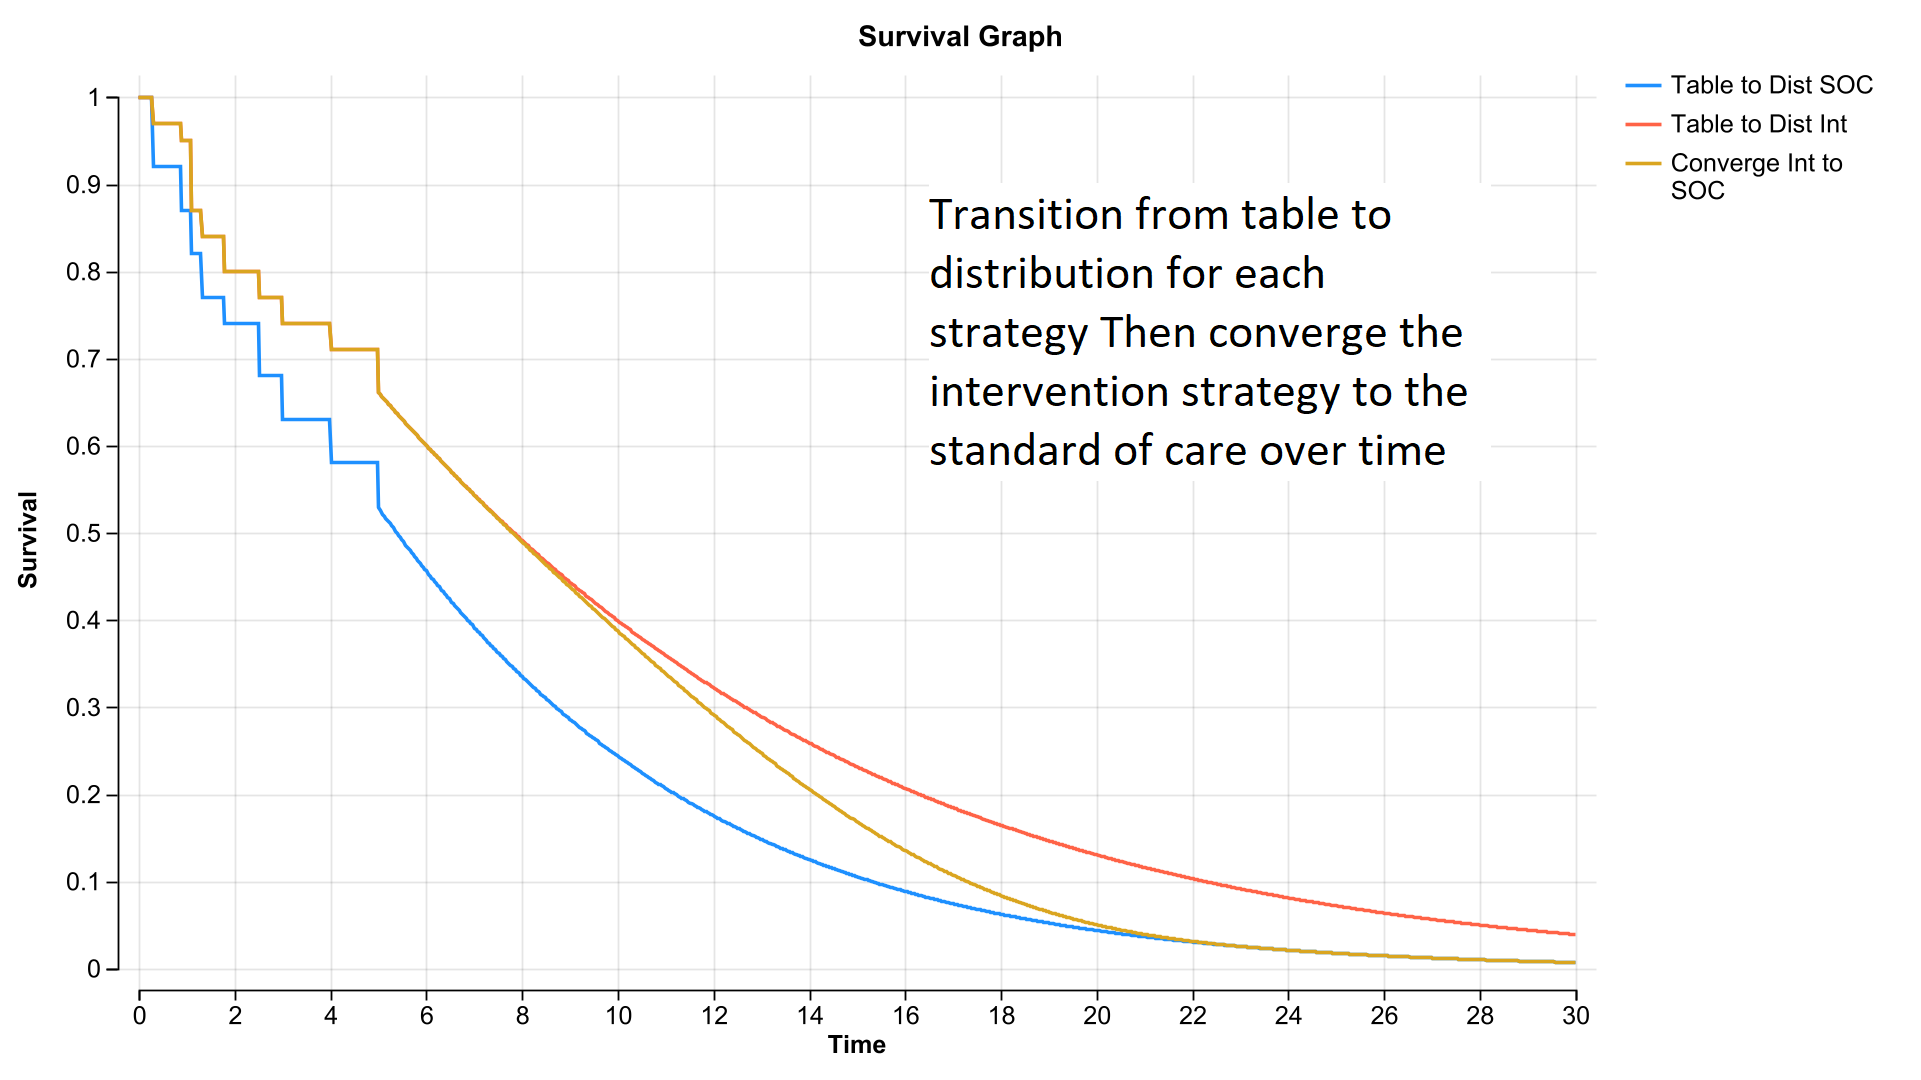
- Combine multiple transitions and blends into a complex curve.
- TreeAge Pro Web Enhancements
- Share Partitioned Survival Models including Survival Curves, Hazard Curves, Cost-Effectiveness and more.
- Share Probabilistic Sensitivity Analysis including Acceptability Curves, ICE Scatterplots and more.
- Users can save graph images and Excel reports for all model outputs.
- Improved Graphs to Visualize Distributions
- When adding/editing distributions, PDF/CDF graphs visually represent the set of possible samples.
- These graphs were enhanced with options to show 95% or 99% of samples to provide better visibility.
- Plot Proportional Hazards from Kaplan-Meier Tables
- Graph two or more Kaplan-Meier Survival Tables and distributions on a logarithmic graph to see if the hazards are proportional.
- Proportional hazards indicate a fixed hazard ratio between any two survival estimates.
TreeAge Pro Business
- Create Model Summary PDF now Includes Node Comments *
- When creating a Model Summary PDF, you can choose to include the text entered as node comments as support for probability estimates.
TreeAge Pro 2025 R2 is available to perpetual license holders that have a valid support contract and to annual license holders that have a valid license. Some features are not available on all license types and may require an active Support Contract for perpetual license holders.