Combine Survival/Hazard Estimates
Combine Survival Estimates with Compound Curves
Analysis of clinical data may provide multiple survival estimates that could be used in Health Economic Models.
Use Compound Curves to combine multiple survival estimates in a single curve to drive disease progression in your models.
Compound Curves combine survival estimates using transitions and blends that can be used independently or together.
Transitions
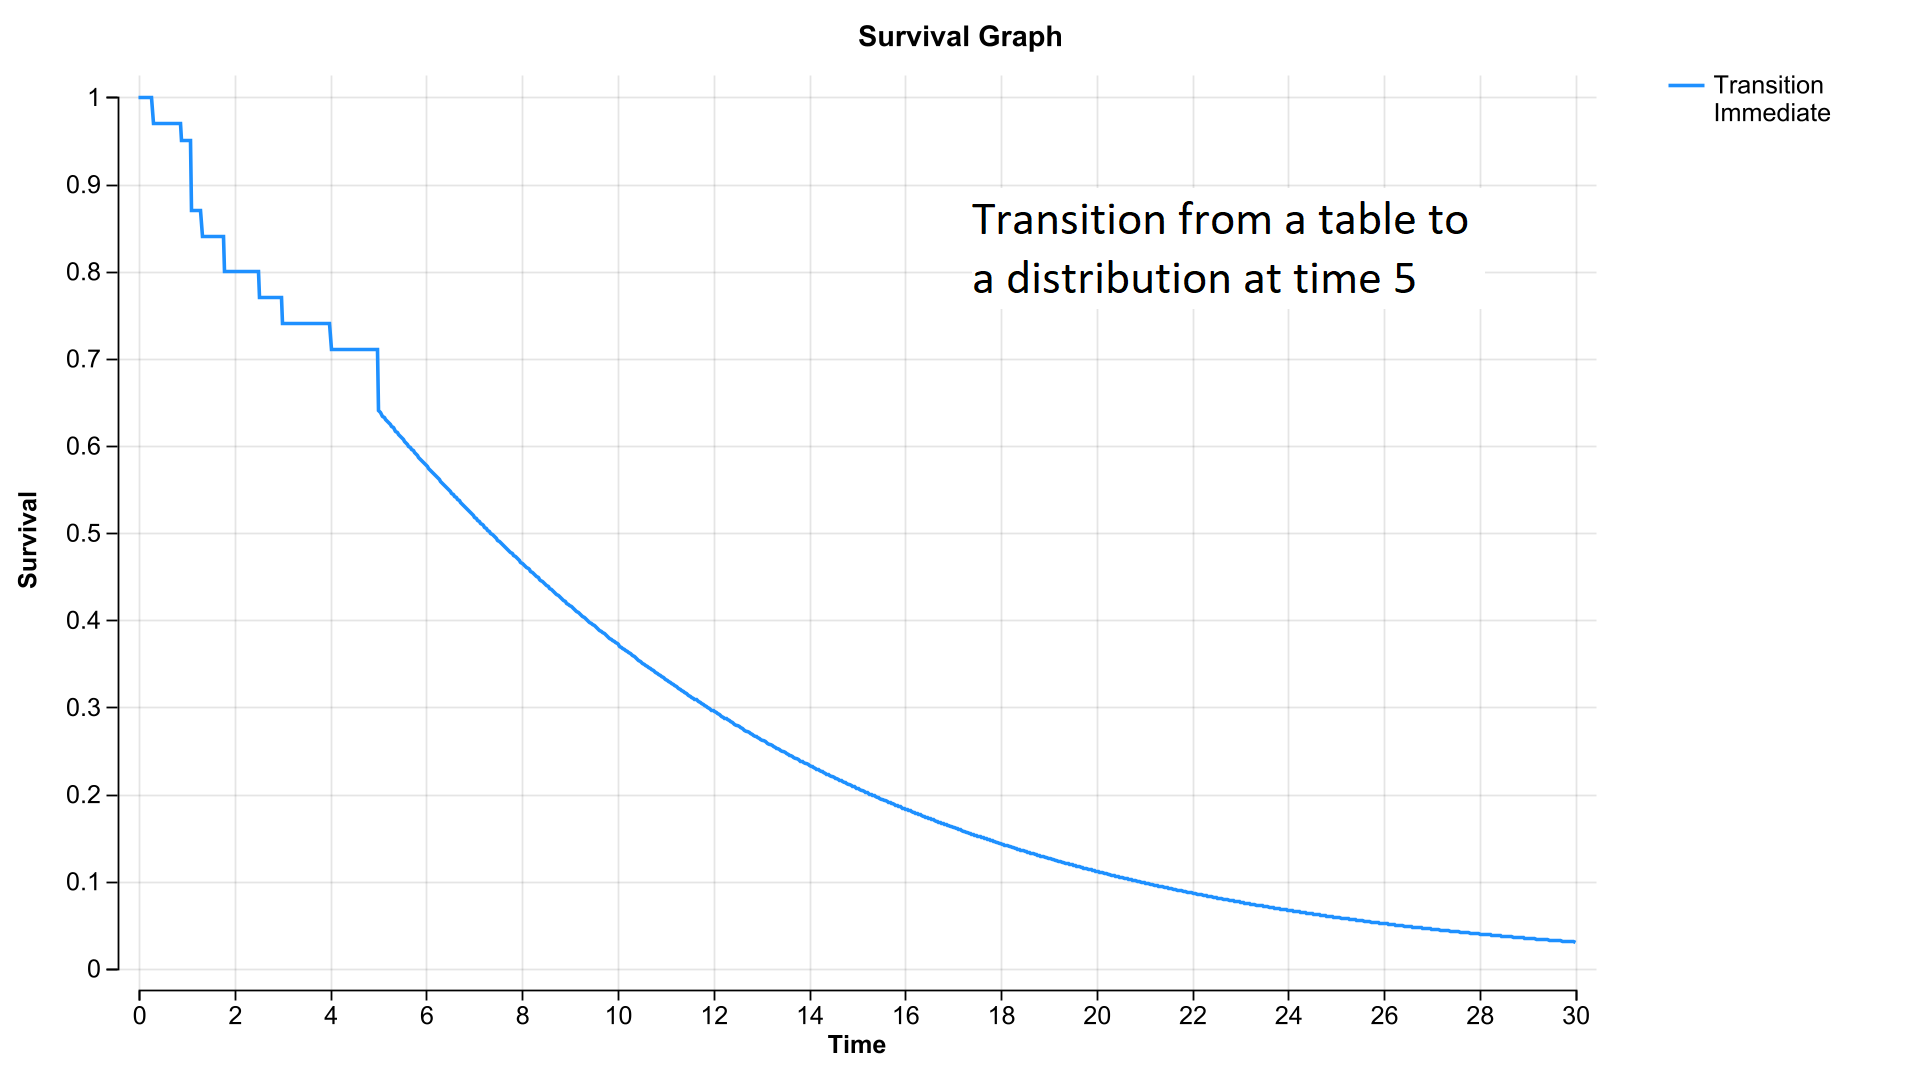
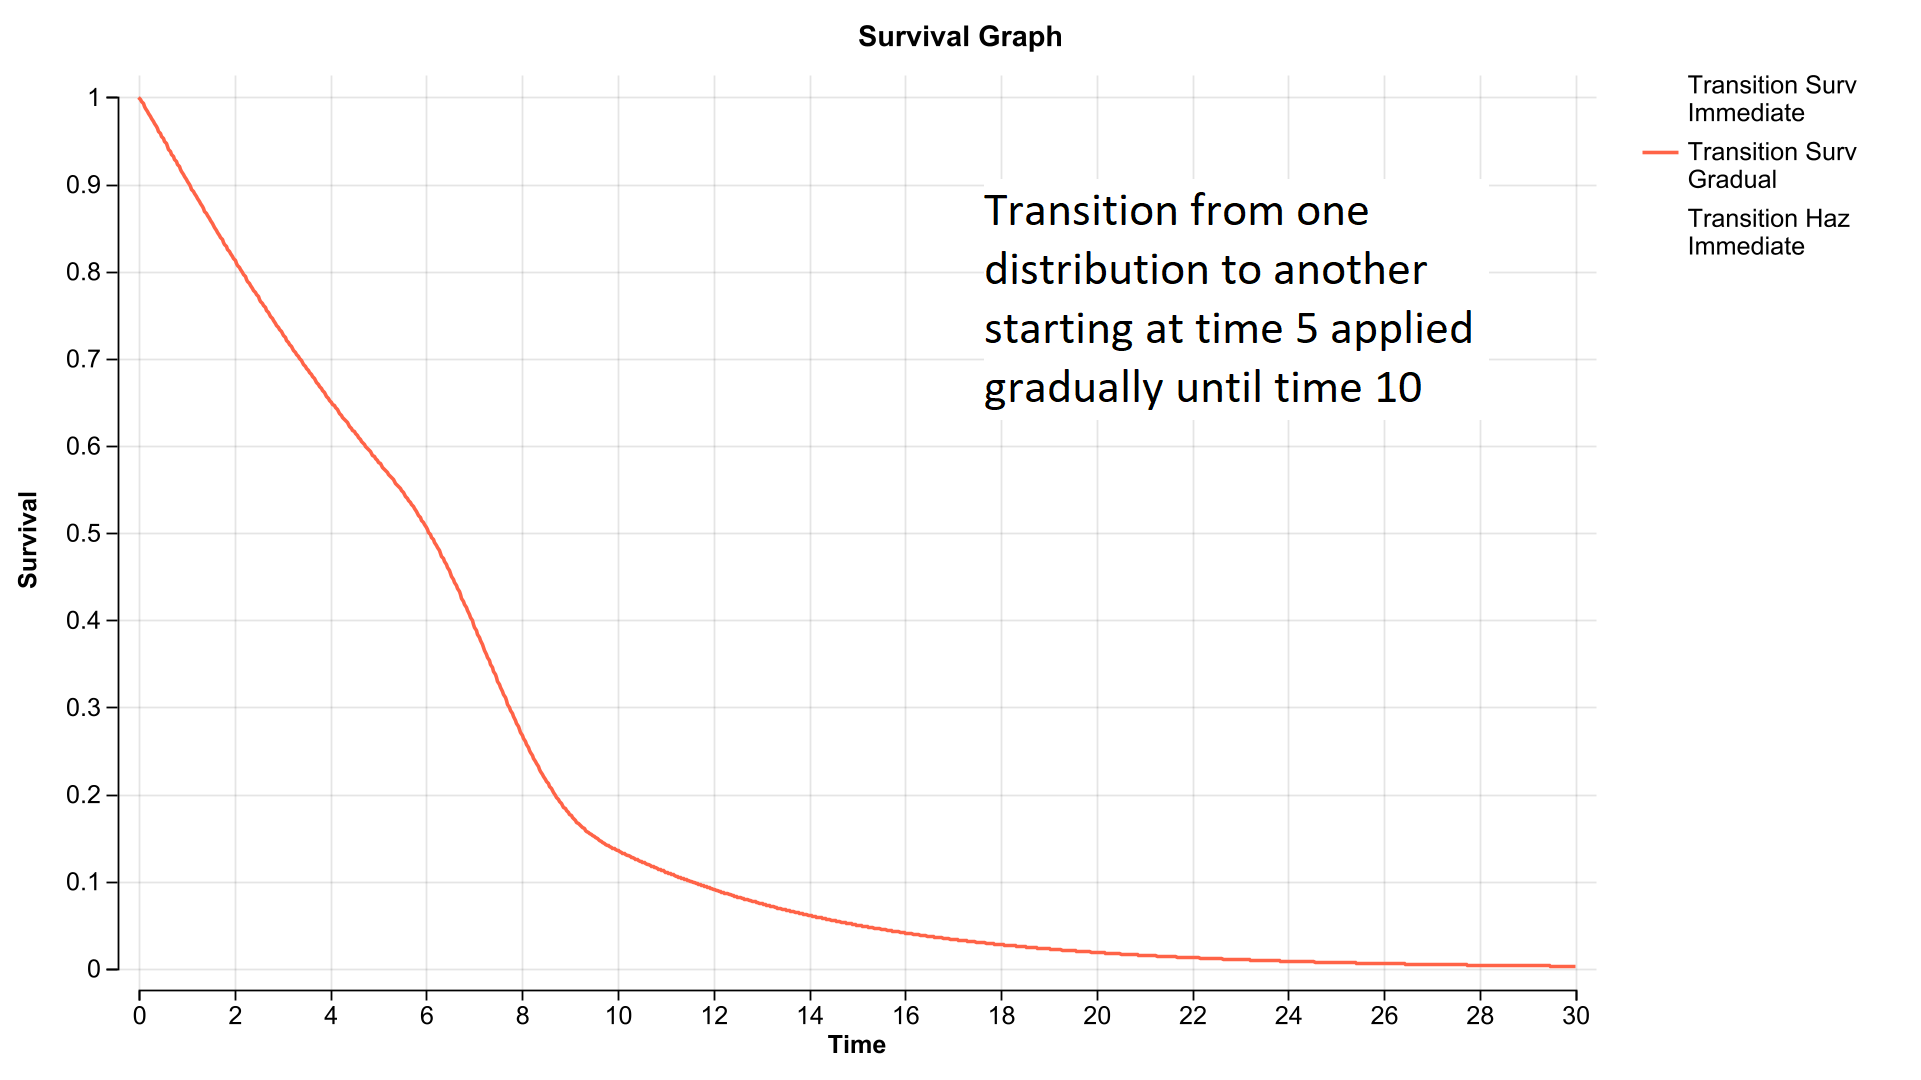
- Transition from one survival estimate to another to form a single survival or hazard curve with the two essentially stitched together.
- You could create a single survival curve that starts with a Kaplan-Meier table for the observed period then switches to a distribution fitted to that data for the extrapolation period.
Blends
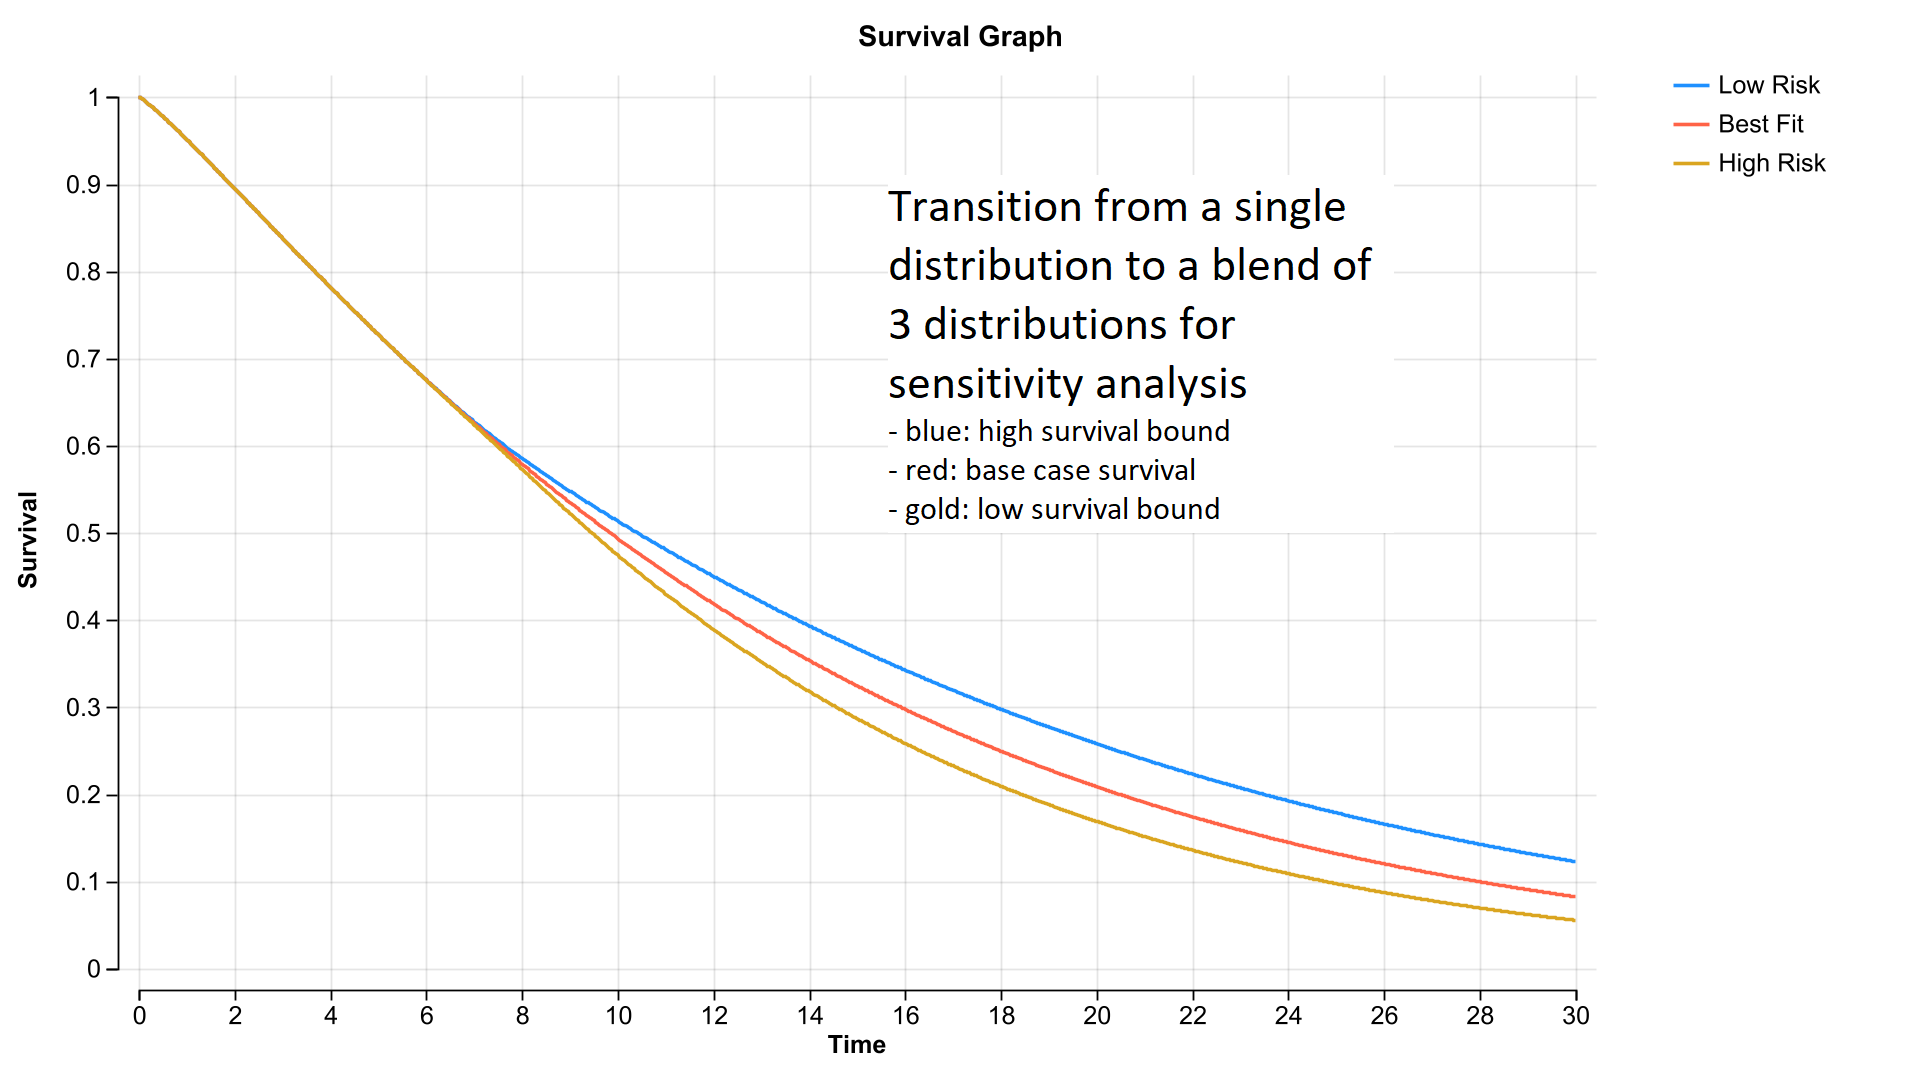
- Blend multiple estimates over the same time period using an average of 2 or 3 survival or hazard curves.
- You could create a blended survival curve where low and high survival estimates represent the bounds for sensitivity analysis.
Compound Curve Examples
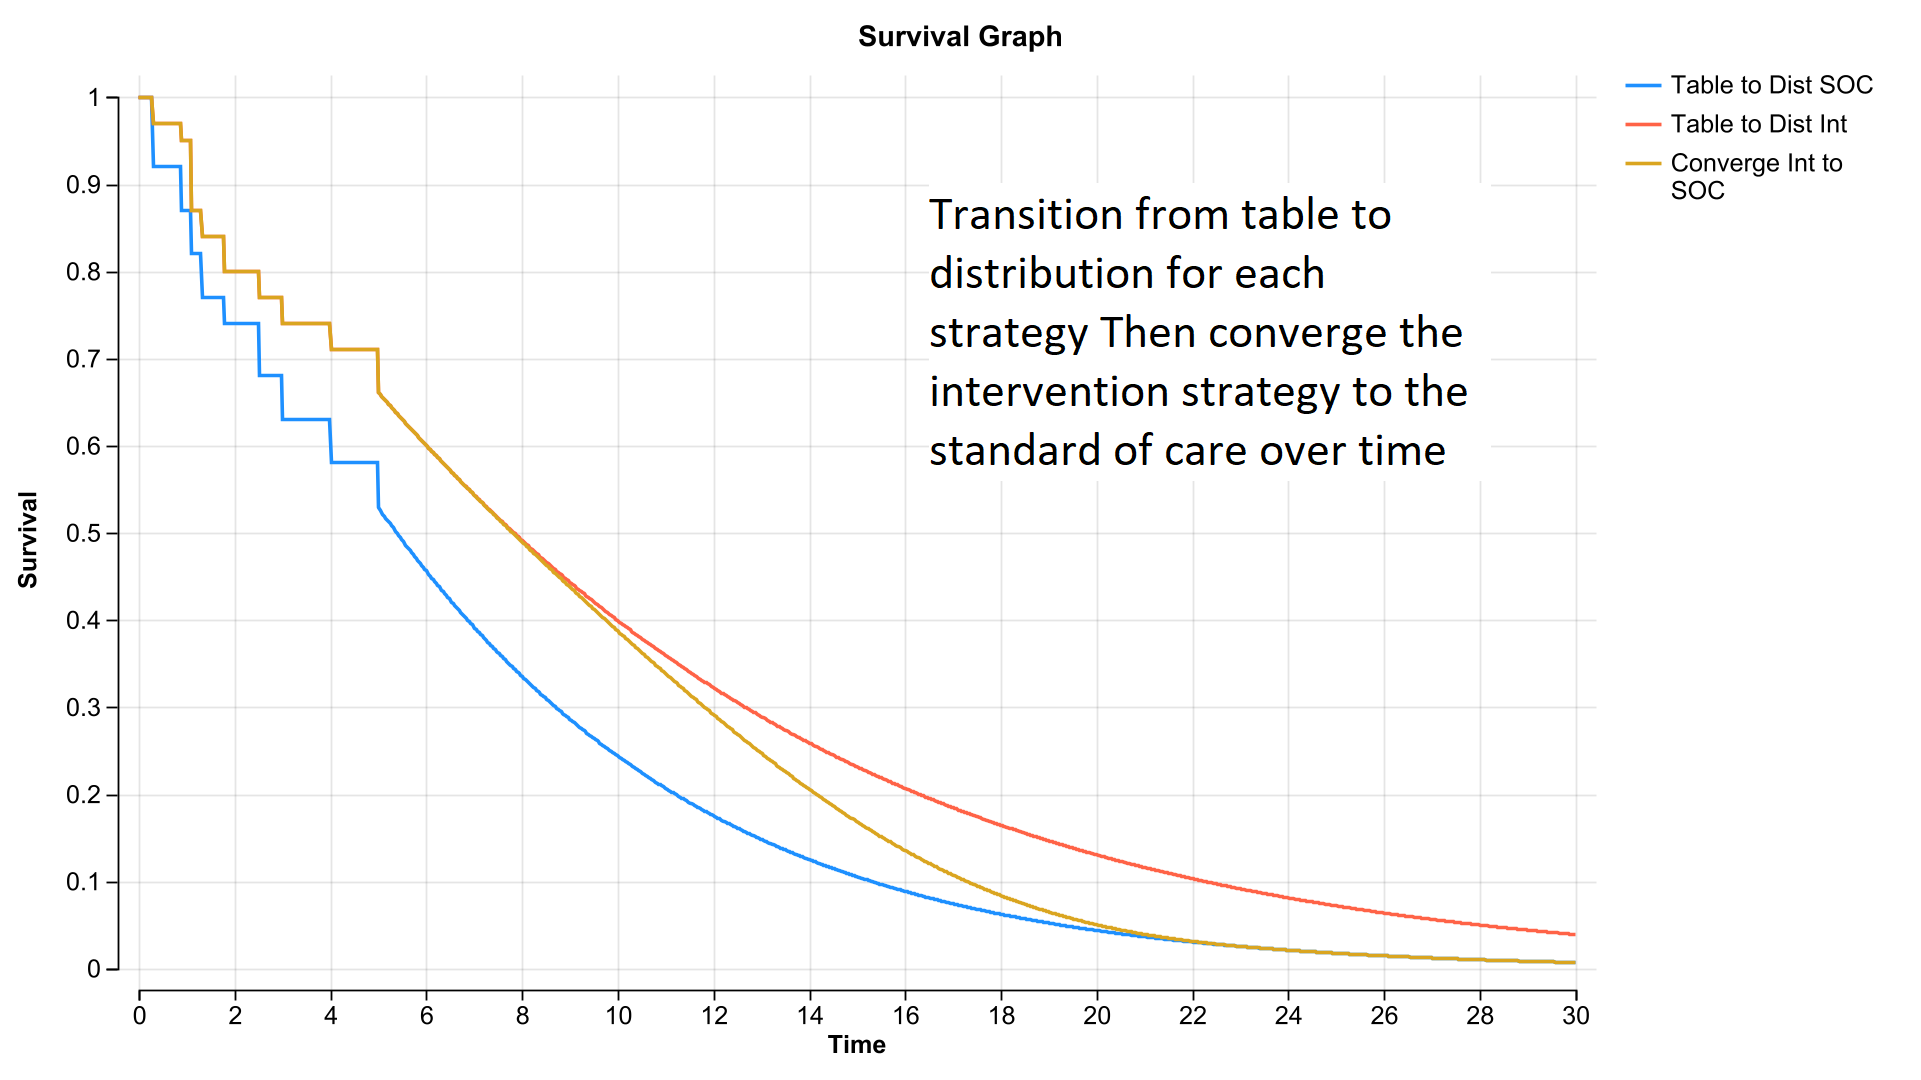
Here are some example survival curves generated from transitions, blends and combinations of both.
Modeling with Compound Curves
Create the Compound Curve
This Compound Curve below transitions from a
Kaplan-Meier survival curve to a fitted distribution.
Compound Curve: Table_to_Dist

Reference the Compound Curve
Reference the Compound Curve with a simple expression
to create a combined survival curve.
The reference defines when the transition should start
and over what time period should it be applied.
Reference: Table_to_Dist[5;0]
