Built-in Analysis & Reporting Tools
Generate the analysis results you need with a few clicks
Sophisticated Healthcare Analysis & Reporting is at your fingertips
Calculations automatically follow your model structure and input values.
You can focus on your project and results, not coding calculations and reports.
TreeAge Pro’s Built-in Analyses Include…
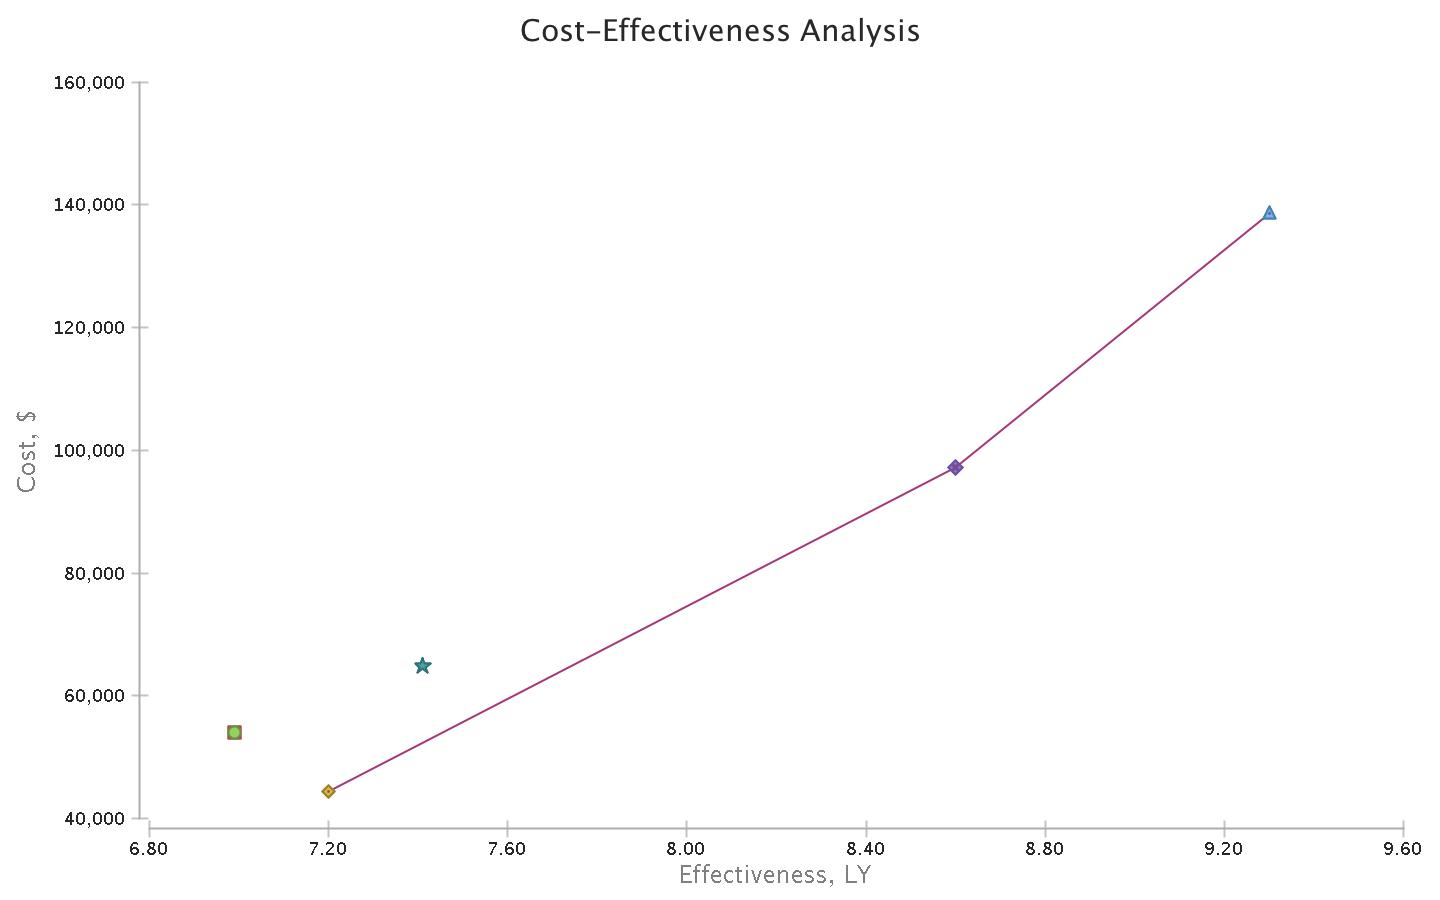
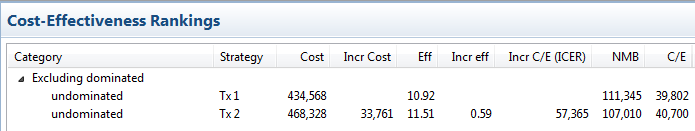
- Cost-Effectiveness Analysis
- Compare diagnostic and/or treatment strategies via ICER/Net Benefits.
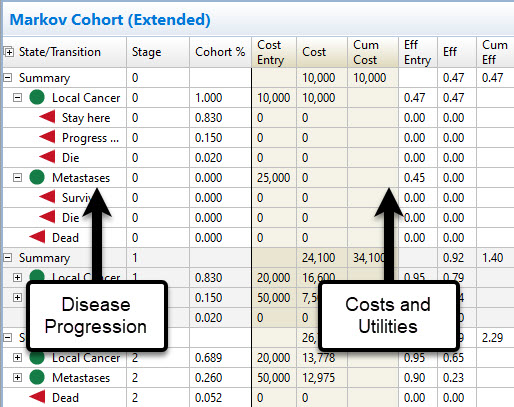
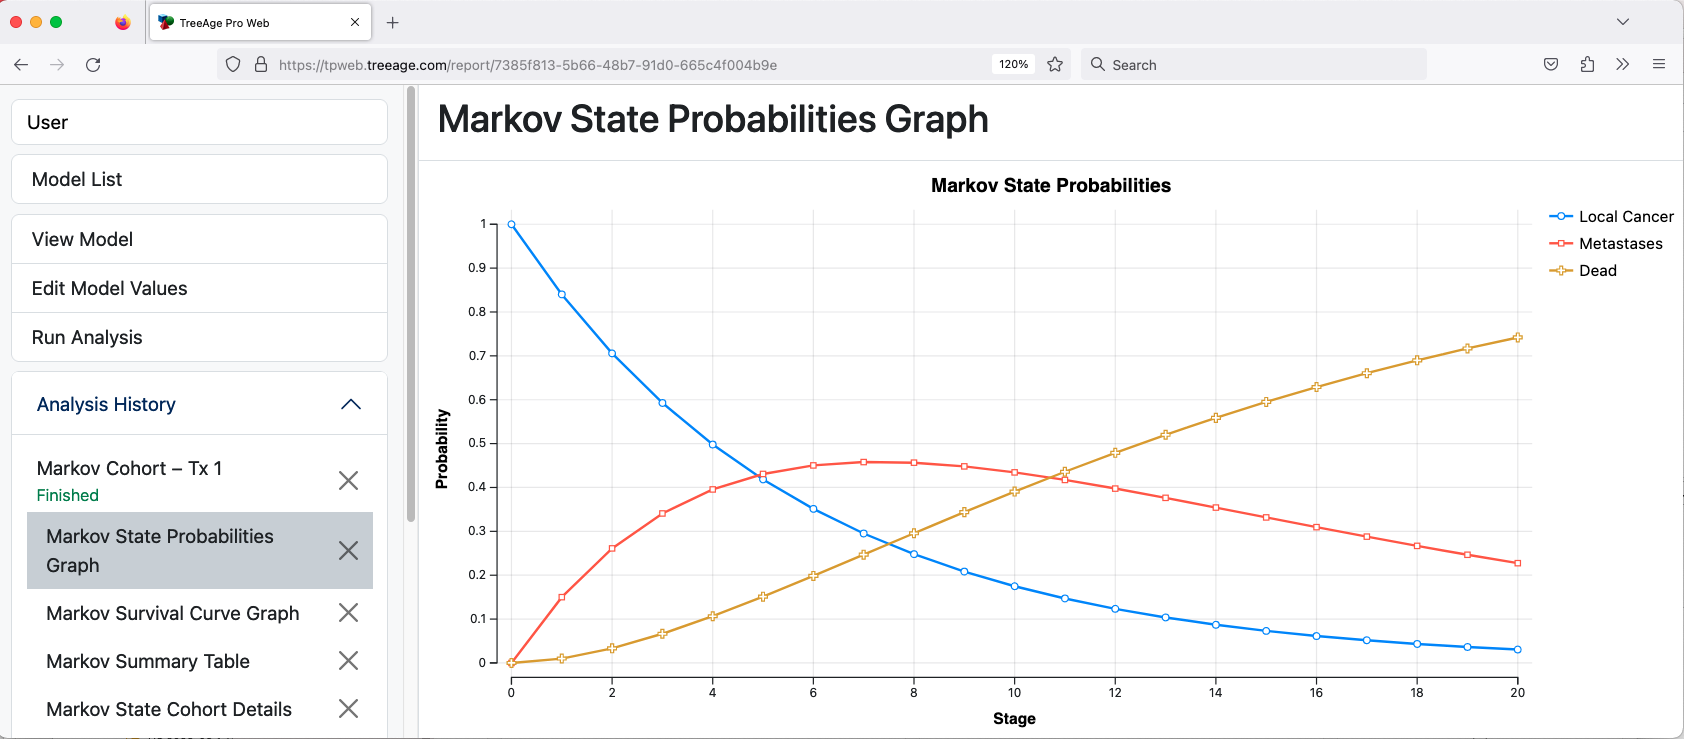
- Markov Cohort Analysis
- Predict disease progression over time with extensive reporting for model validation.
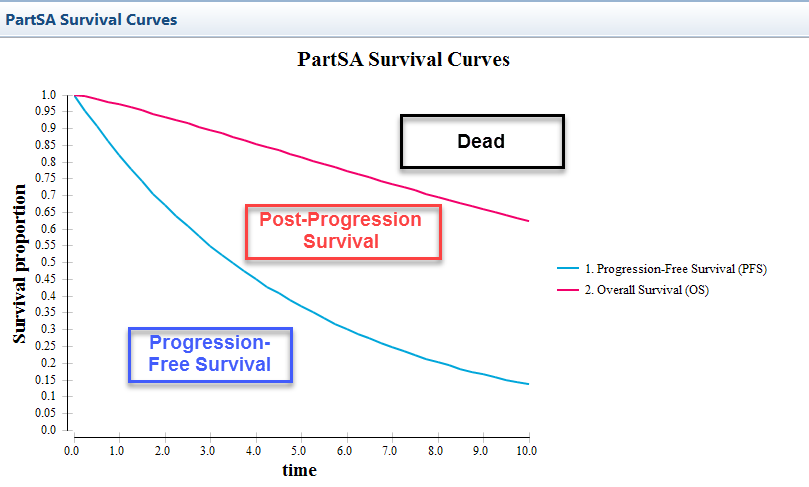
- Partitioned Survival Analysis
- Predict disease progression from clinical survival curves.
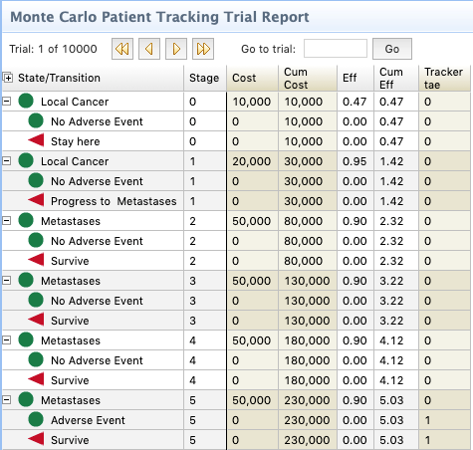
- Patient Simulation
- Use simulated patients to incorporate characteristics and critical patient events.
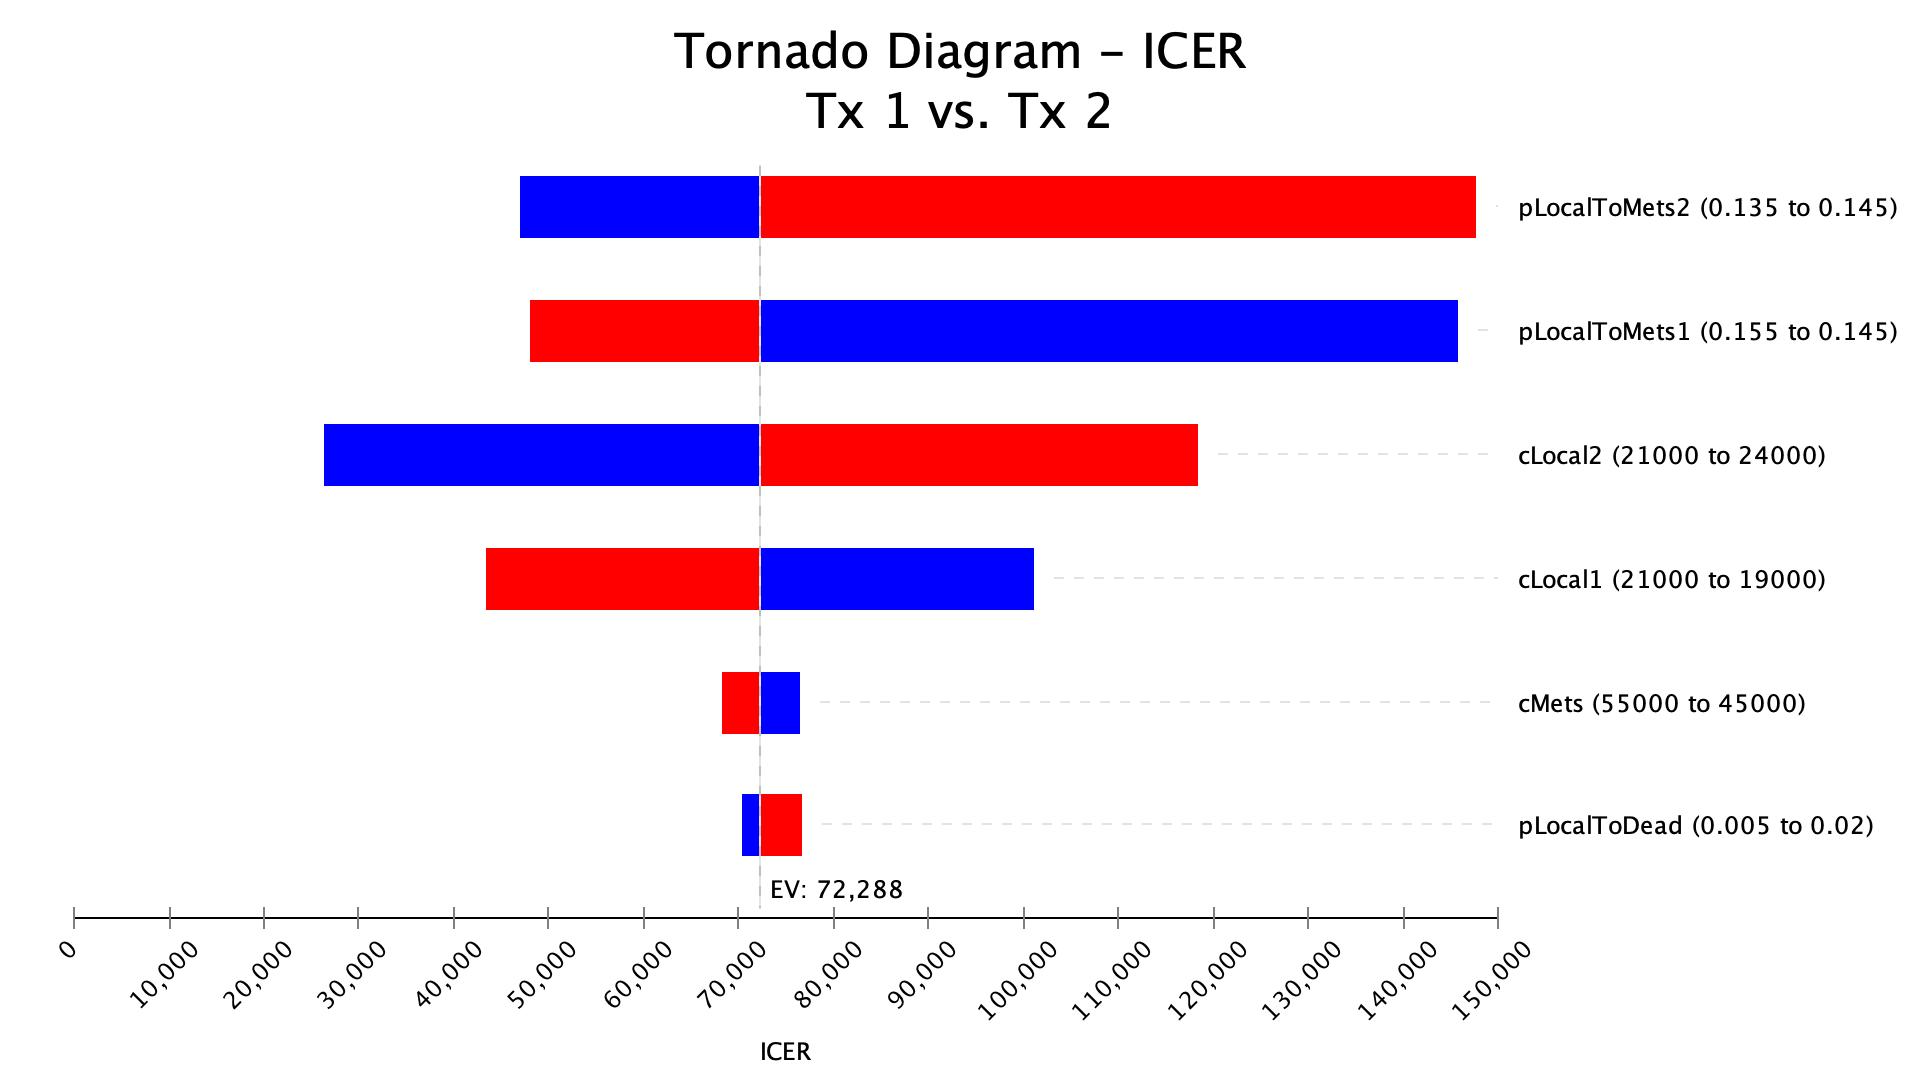
- Sensitivity Analysis/Tornado Diagrams
- Evaluate the impact of parameter uncertainty on your model results.
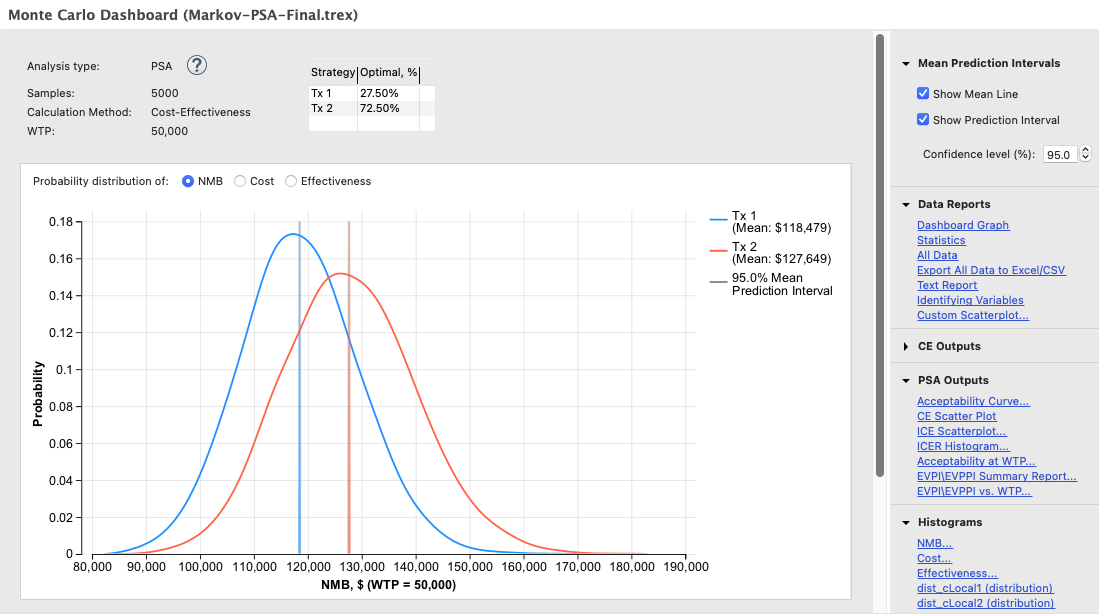
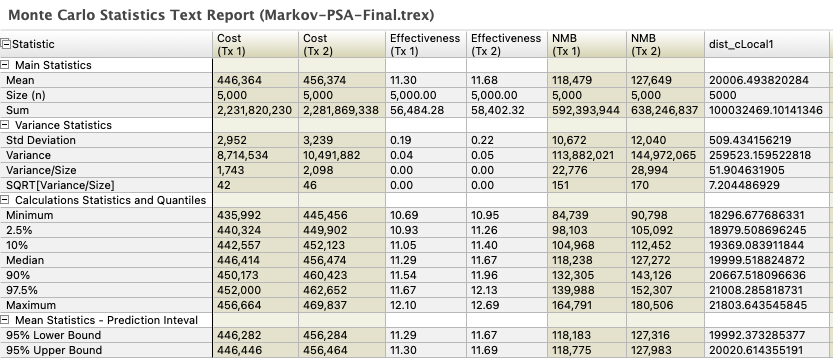
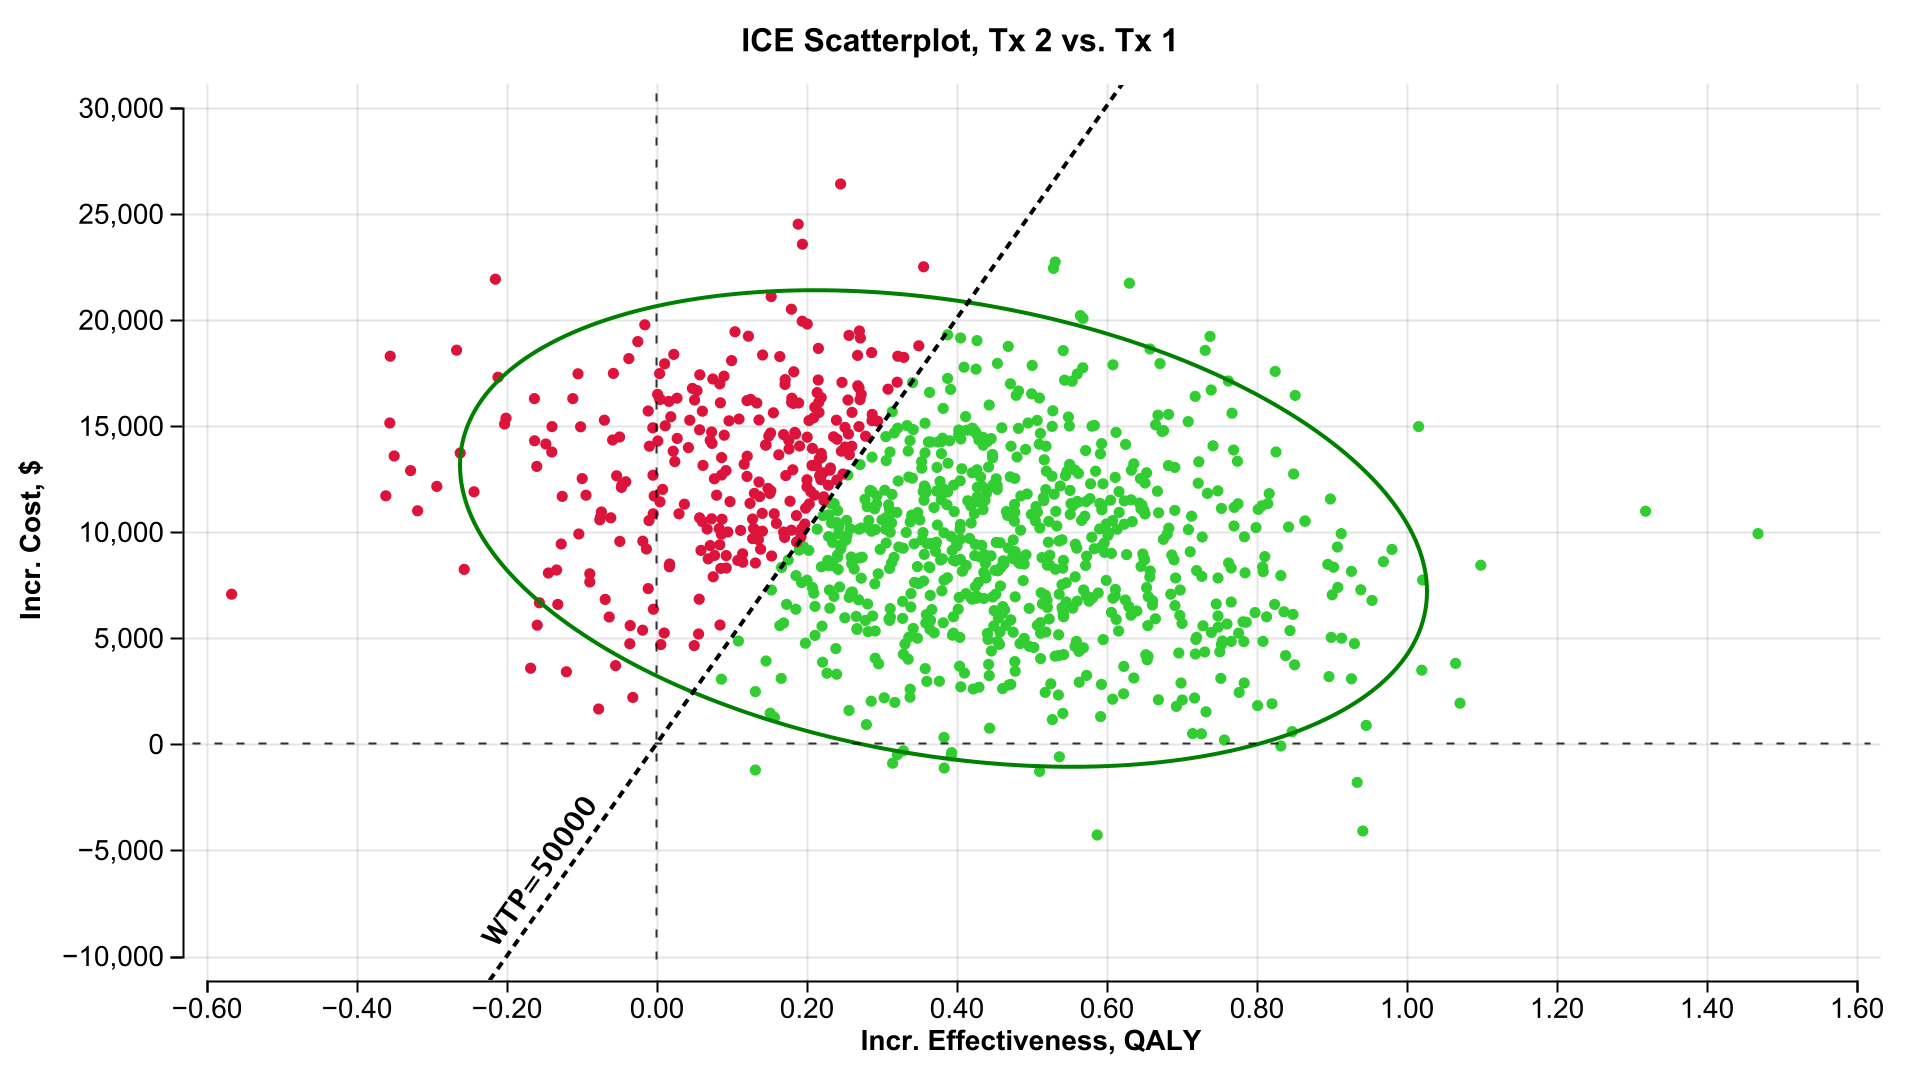
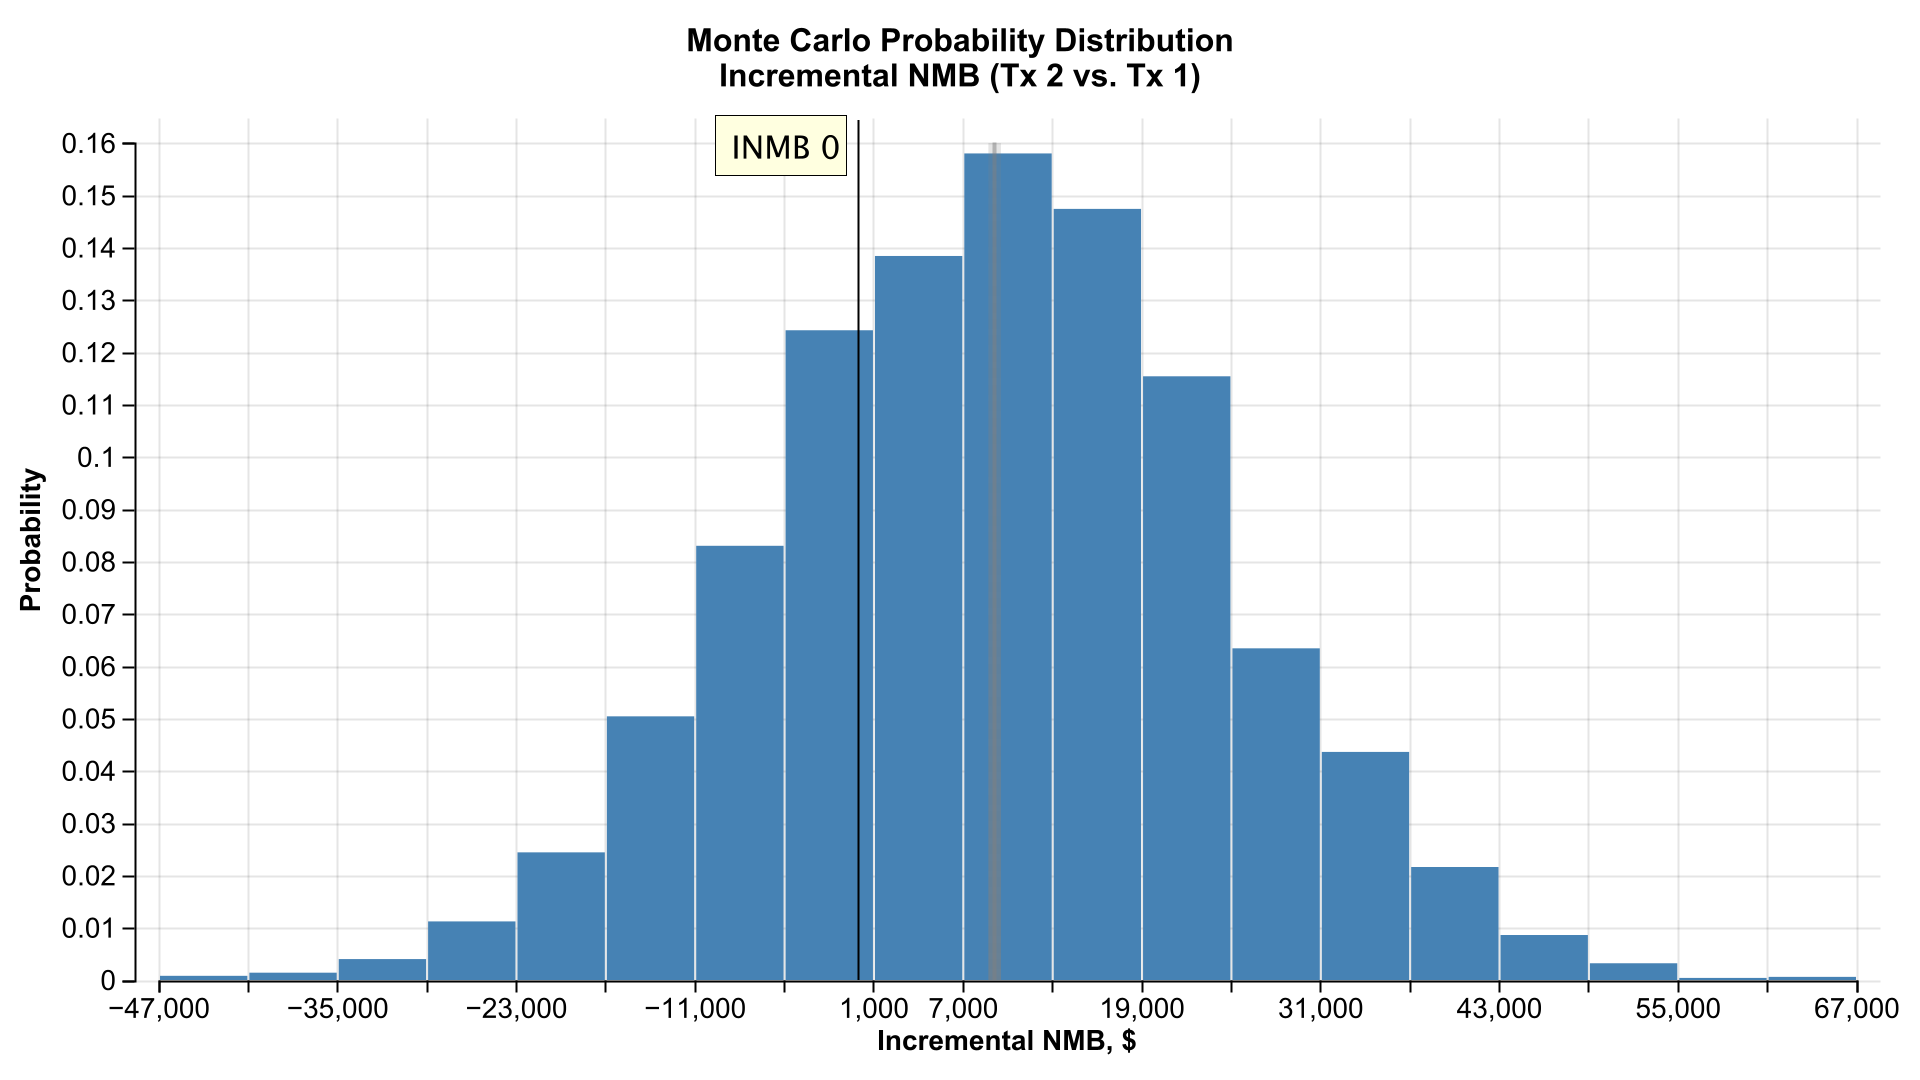
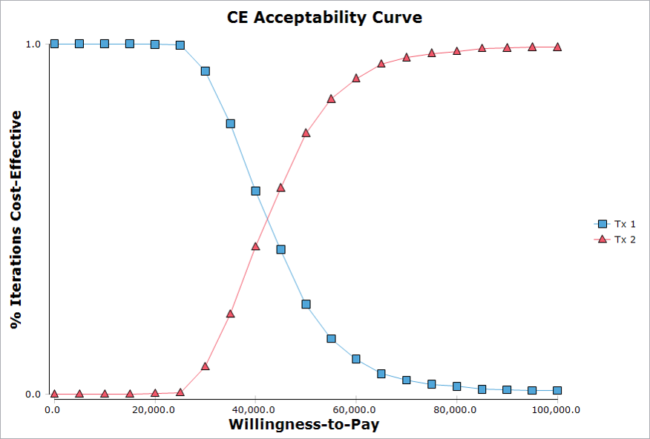
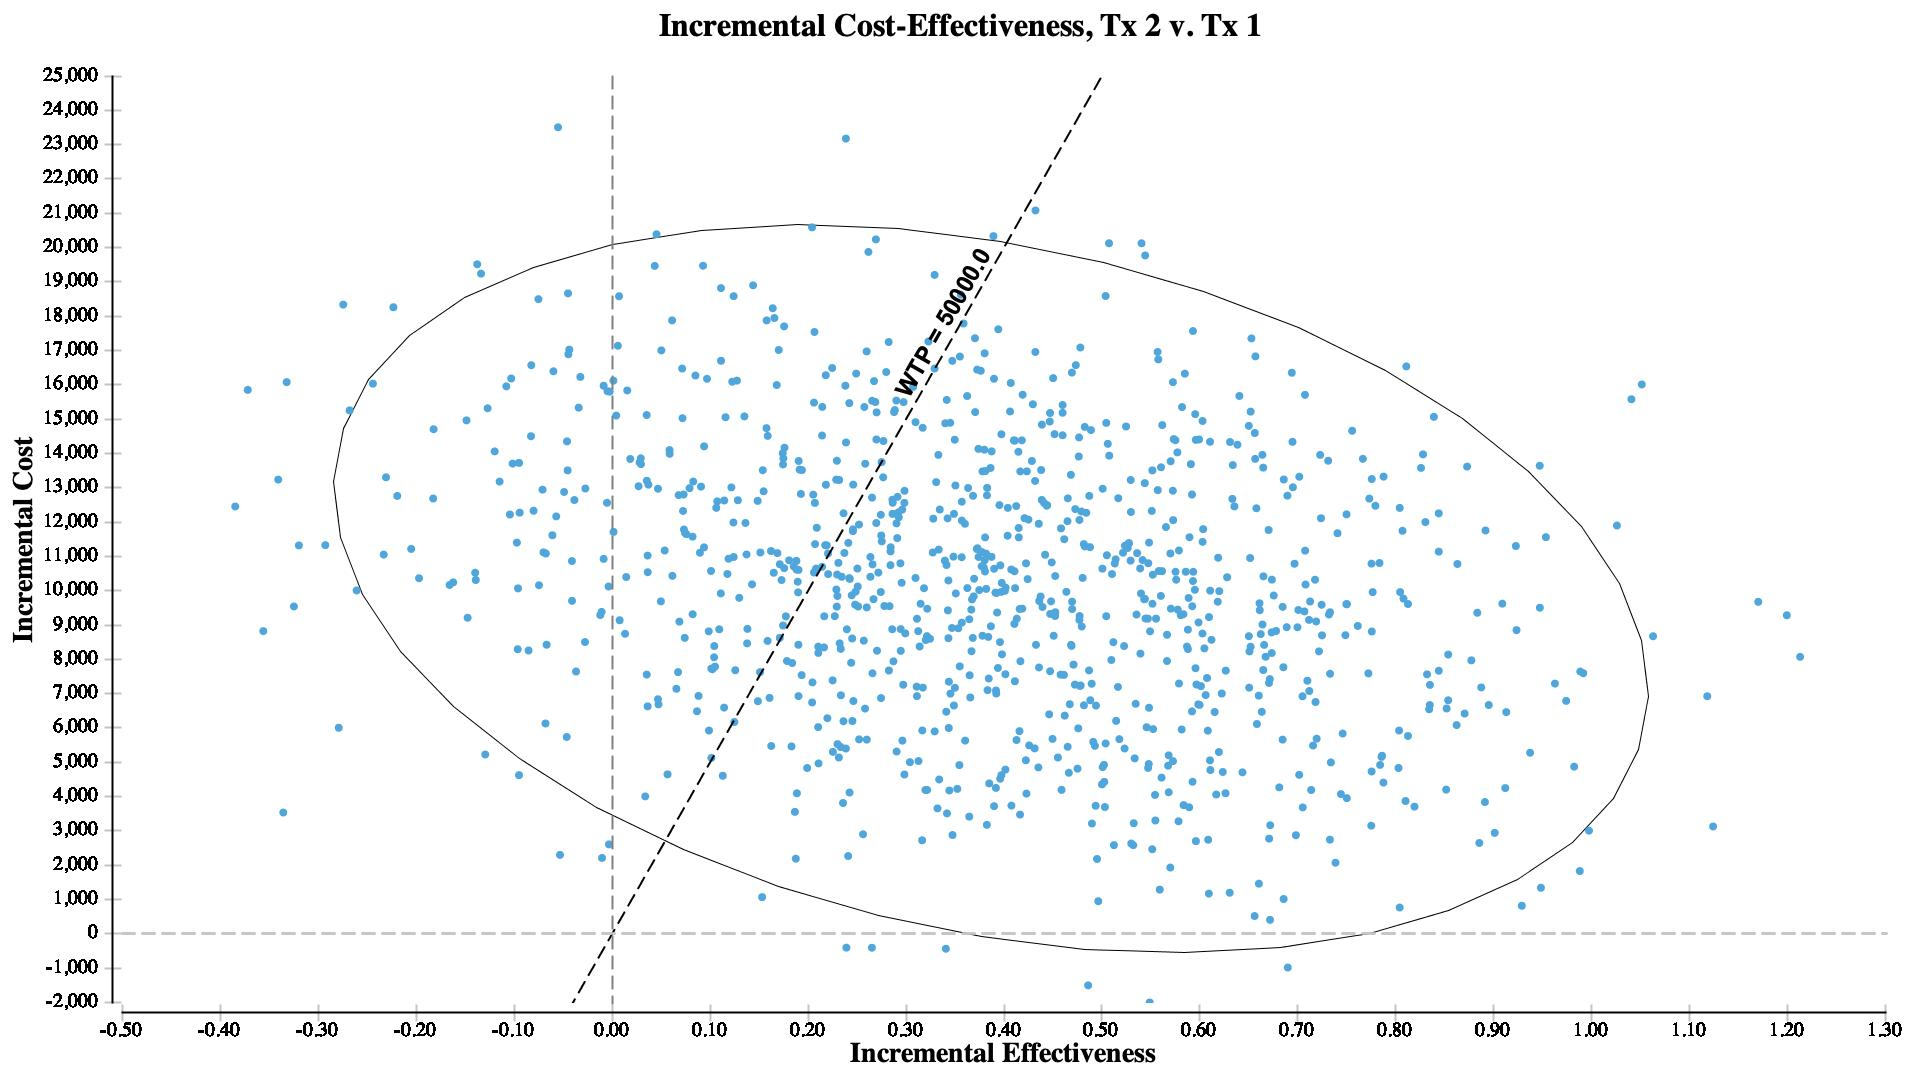
- Probabilistic Sensitivity Analysis
- Evaluate the overall confidence in your model results from combined parameter uncertainty.
- And so much more!
Review Cohort Flows for Markov and Patient Simulation models
- Examine state membership over time to validate disease progression.
- See how cost, utility and other model outputs are accumulated as patients move through the pathways.
- Customize graphs and share them with colleagues.
Dashboards to interpret complex analyses
- Dashboards provide a summary for an overall view of the results (PSA to right).
- Links to dozens of additional graphs and reports to help interpret and communicate those results.