
Sophisticated Health Economic Modeling:
Building Models You Can Understand and Defend
Health economic models must capture enough of a clinical and decision problem to produce useful evidence. That can require different disease states, patient characteristics, treatment pathways, time-dependent risks, resource use, and uncertainty. Yet sophistication is not synonymous with a large model, a long script, or a complicated diagram. The more important question is whether the model represents the problem appropriately—and whether its assumptions and results can be examined.
TreeAge Pro Healthcare provides a purpose-built environment for developing and analyzing sophisticated health economic models visually. Its value is not simply that model structures can be drawn. It is that modelers can combine clinical logic, simulation, economic outcomes, and analytical tools in a framework designed to make important relationships visible and open to investigation.
1. Sophistication is more than model size or coding
A small model can be sophisticated when it captures the critical distinctions needed for a decision. A larger model can be misleading if its complexity is difficult to justify, test, or explain. Sophistication therefore includes choosing the right level of detail, representing uncertainty honestly, and understanding the consequences of structural assumptions.
Visual modeling and code-based modeling are not opposing categories of rigor. Both can support advanced methods. TreeAge Pro offers a visual, purpose-built alternative for teams that want to construct and analyze complex decision logic without making extensive programming the primary interface to the model.
Consider an illustrative colorectal cancer screening comparison: no screening, periodic colonoscopy, and annual fecal immunochemical testing (FIT). Even with a compact set of disease states, the analysis can incorporate adherence, different test characteristics, follow-up procedures, patient-specific risk, and long-term outcomes. Its sophistication comes from how those mechanisms interact—not from the number of boxes in the diagram.
2. Representing meaningful clinical and economic complexity
Clinical evidence rarely arrives in a form that maps directly onto a single transition probability. Risk may change with age or time; patient groups may differ; interventions can alter later events; and resource use depends on what actually happens along a pathway. An effective health economic model must translate those relationships into explicit assumptions and calculations.
TreeAge Pro supports multiple modeling structures, including decision trees, state-transition models, partitioned survival approaches, patient simulation, and discrete-event simulation. The modeling approach should follow the clinical question and available evidence rather than the other way around.
In the illustrative screening model, patients can occupy no-adenoma, adenoma, colorectal cancer, or death states. They differ in baseline risk, encounter screening opportunities, and may have adenomas detected and removed. Costs and quality-adjusted life-years (QALYs) accumulate over time. This example is deliberately simplified, but it demonstrates how clinical pathways and economic consequences can be represented together.
The annual FIT strategy shown below illustrates how screening eligibility, adherence, test results, diagnostic follow-up, and disease progression are integrated within the model’s visual structure.
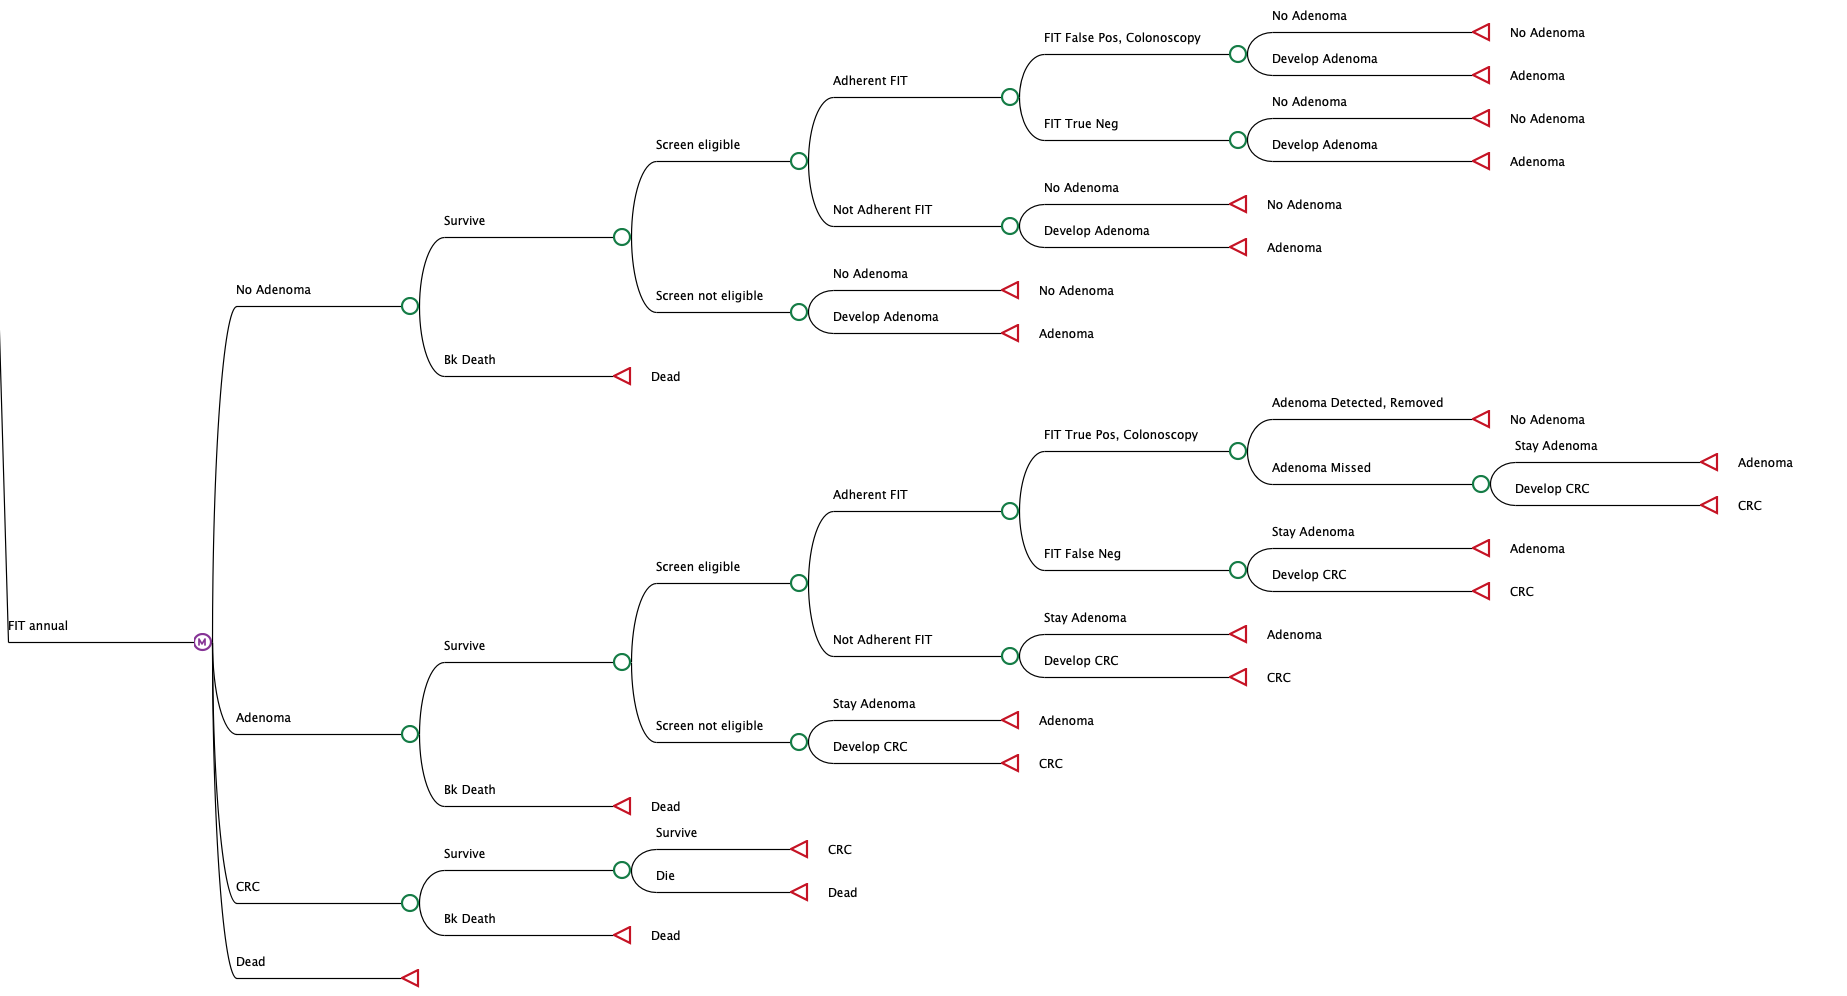
Figure 1. Sophisticated screening logic represented visually in TreeAge Pro Healthcare, combining Markov health states, patient-level decisions, diagnostic follow-up, and disease progression.
3. Combining techniques in one coherent model
Many decision problems cannot be represented adequately by a single modeling technique used in isolation. A state-transition framework may describe disease progression, while patient-level simulation captures heterogeneity and history-dependent decisions. Decision logic can govern testing, adherence, and follow-up; economic calculations then connect these events to outcomes.
TreeAge Pro allows these techniques to be brought together in a single model. In our screening example, each simulated patient is assigned a risk profile. Screening adherence is evaluated at each opportunity, while FIT outcomes can lead to diagnostic colonoscopy. A previous colonoscopy also changes when that individual becomes eligible for future FIT screening. Consequently, the same nominal strategy can generate different sequences of care for different patients.
That is a practical example of why patient-level simulation matters: the next event depends not only on the current health state, but also on who the patient is and what has happened previously.
This history-dependent behavior is implemented through patient-level tracking variables. Following diagnostic colonoscopy, the model updates the patient’s next eligible FIT screening age according to the outcome. The resulting screening decisions can therefore reflect previous clinical events, while the simulation continues to accumulate costs, QALYs, and other outcomes.
For example, FIT screening is permitted only when the patient is within the eligible age range and has reached the next screening age recorded in their individual patient tracker.
(ageCurr <= ageLastScreen) & (ageCurr >= t_NextFITAge)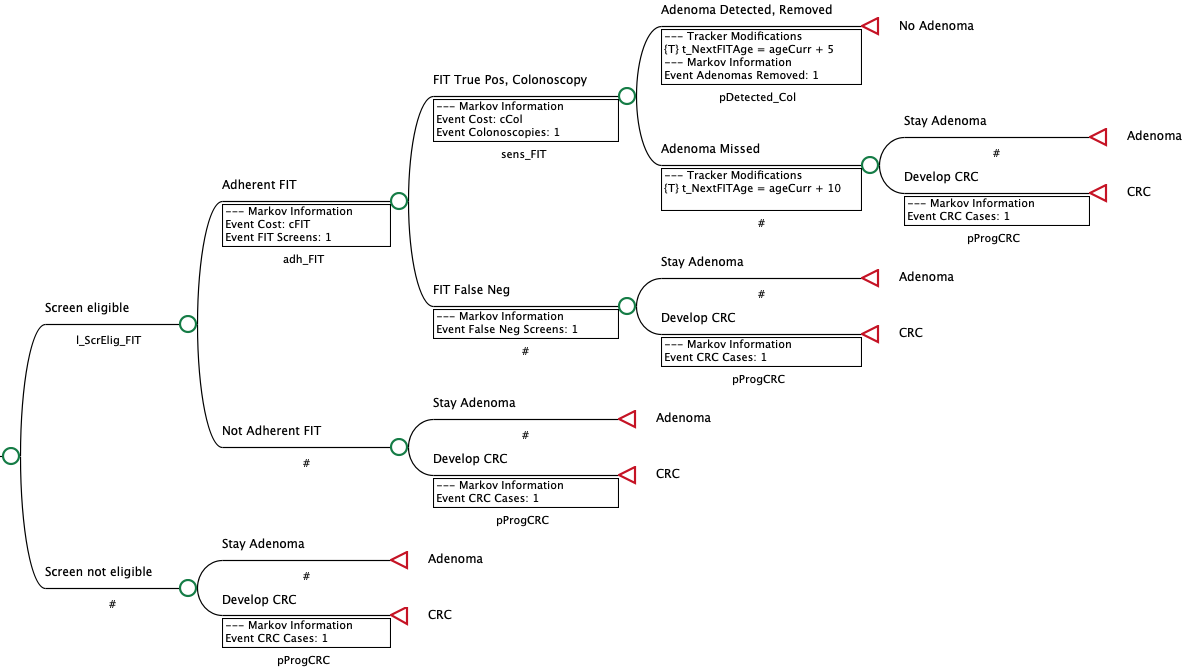
Figure 2. History-dependent screening decisions in TreeAge Pro Healthcare. Visual pathways integrate FIT adherence, diagnostic colonoscopy, adenoma detection, and patient-level tracking variables that determine future screening eligibility.
4. Making sophisticated models understandable and reviewable
As models become more capable, the burden of review grows. Analysts and collaborators need to understand which decisions are represented, where probabilities are applied, how events are counted, and which assumptions govern transitions. A result is easier to trust when the path from assumptions to outcomes can be followed.
TreeAge Pro’s visual structure makes decision pathways and state transitions inspectable. Variables, expressions, and event assignments can be examined alongside the model logic. This does not replace validation, but it gives modelers and reviewers a direct way to examine how the model has been assembled.
The screening example makes this concrete: a reviewer can follow the pathway from an annual FIT opportunity through adherence, test outcome, diagnostic colonoscopy, possible adenoma removal, and subsequent screening eligibility. The important question is not simply whether the model runs, but whether it behaves as intended.
Patient-level simulation provides opportunities to examine model behavior beyond aggregate results. In the illustrative screening model, TreeAge Pro can track individual patient histories, including screening events, diagnostic colonoscopies, changes in screening eligibility, and disease progression. These histories can be examined alongside cohort-level reports to understand how individual pathways contribute to population outcomes. This provides an additional way to review whether the model is behaving as intended.
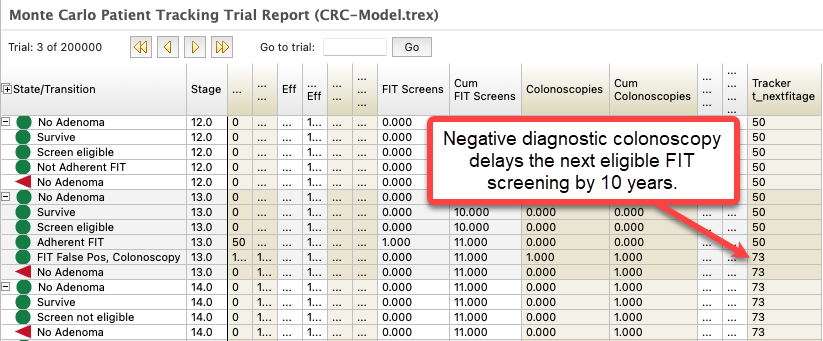
Figure 3. Patient-level tracking in TreeAge Pro Healthcare. A false-positive FIT result triggers diagnostic colonoscopy, updating the patient’s next eligible FIT screening age. The report illustrates how individual patient history influences subsequent decisions within the simulation.
5. Interrogating model behavior—not just reading results
Aggregate cost-effectiveness results summarize many individual pathways. They do not, by themselves, explain why those results arose. Sophisticated modeling requires ways to investigate the behavior underneath the averages.
TreeAge Pro supports this investigation through patient-level tracking, cohort reports, and calculation debugging. Together, these capabilities allow analysts to examine individual pathways, investigate patterns across simulated patients, and inspect the calculations underlying model behavior.
When a result is unexpected, a calculation trace can provide another level of inspection: the analyst can examine the variables and expressions that produced a particular probability or decision. Tracking describes what happened; calculation-level debugging helps establish why the model calculated it that way.
Cohort-level tracking provides another way to investigate model behavior. In the illustrative screening model, the extended cohort report shows how simulated patients move through screening and diagnostic pathways, including FIT adherence, positive test results, diagnostic colonoscopy, and adenoma detection. This allows analysts to examine the frequency of events and transitions within the model, rather than relying only on its final outcomes.
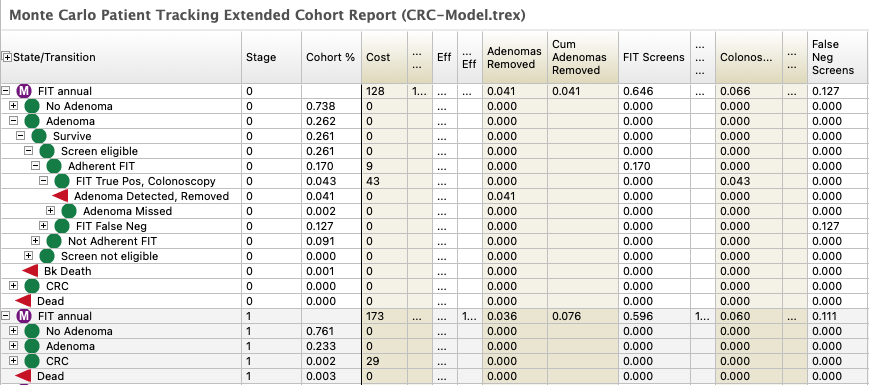
Figure 4. Extended cohort tracking in TreeAge Pro Healthcare. The report aggregates results across simulated patient pathways, showing the proportion of patients following different screening and diagnostic branches, alongside aggregated event measures and clinical outcomes. This allows analysts to investigate population-level model behavior beyond summary results.
6. Testing assumptions and supporting defensible decisions
Health economic results depend on both evidence and modeling choices. Screening participation, test performance, procedure costs, transition risks, and follow-up rules can all affect the balance of costs and outcomes. Reporting a single incremental cost-effectiveness ratio is therefore not enough: analysts must examine how conclusions respond to uncertainty.
TreeAge Pro provides economic evaluation and sensitivity-analysis tools that help modelers compare strategies, test assumptions, and examine simulation variability. In our illustrative screening analysis, changing adherence alters screening opportunities and downstream events. Repeated patient simulations also show why a small difference in average effectiveness should not automatically be treated as a robust difference between strategies.
The illustrative colorectal cancer screening model demonstrates how TreeAge Pro Healthcare brings together results from a large patient-level simulation. The Monte Carlo dashboard summarizes average costs, quality-adjusted life-years, and net monetary benefit for each strategy, while also displaying the distribution of individual patient outcomes. These complementary views allow analysts to examine both aggregate results and the variability underlying them.
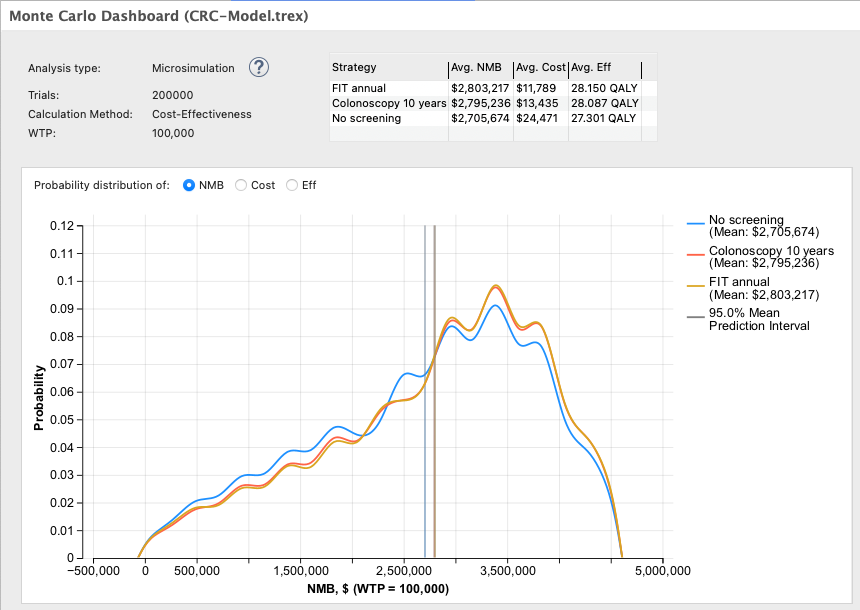
Figure 5. Aggregate results from a 200,000-patient microsimulation in TreeAge Pro Healthcare, showing strategy-level outcomes and the distribution of patient-level net monetary benefit.
The average costs and quality-adjusted life-years generated by the microsimulation provide the basis for incremental cost-effectiveness analysis. TreeAge Pro Healthcare uses these outcomes to rank competing strategies, identify dominated alternatives, and calculate incremental cost-effectiveness ratios where appropriate. The analysis connects detailed patient-level simulation with a structured economic comparison, while retaining the clinical and resource-use outcomes that help explain differences between strategies.

Figure 6. Cost-effectiveness rankings based on average outcomes from the TreeAge Pro Healthcare microsimulation, identifying dominated strategies and reporting incremental economic and clinical outcomes.
Cost-effectiveness rankings reflect the model’s current assumptions, but those assumptions may be uncertain. TreeAge Pro Healthcare provides sensitivity analysis tools to investigate how changes in clinical risks, screening participation, test performance, and costs influence the relative performance of competing strategies. In the illustrative screening model, a tornado diagram of incremental net monetary benefit identifies influential assumptions and shows where changes in those assumptions could reverse the preferred strategy.
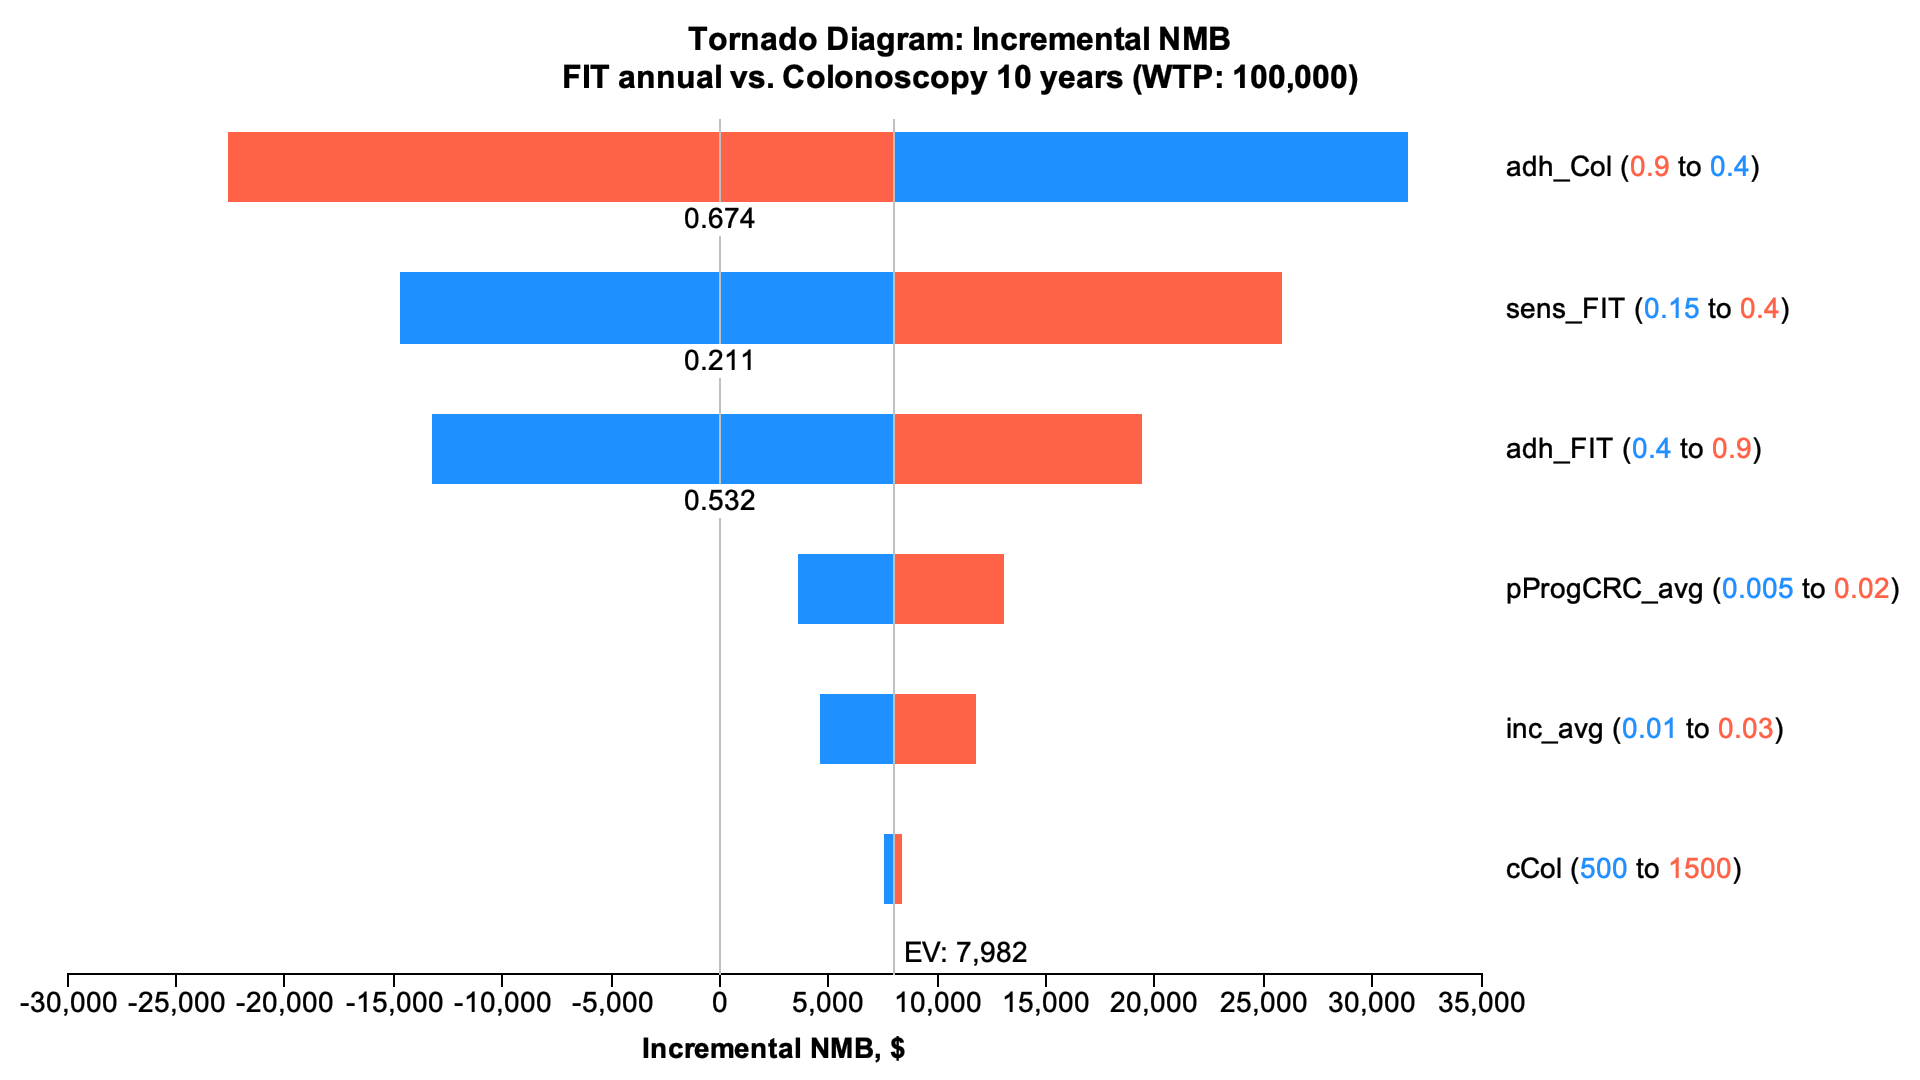
Figure 7. One-way sensitivity analysis of incremental net monetary benefit for annual FIT versus colonoscopy every 10 years in TreeAge Pro Healthcare. The tornado diagram identifies influential assumptions and illustrates how changes in model inputs can alter the preferred strategy.
Conclusion: Sophisticated modeling should also be understandable
Sophisticated health economic modeling is not defined by the amount of code written or the complexity of the model’s structure. It is defined by the ability to represent the clinical and economic problem appropriately, incorporate relevant patient-level complexity, and produce results that can be examined, challenged, and explained.
TreeAge Pro Healthcare brings these capabilities together in a visual modeling environment that supports sophisticated model structures, patient-level simulation, detailed reporting, economic evaluation, and sensitivity analysis. Modelers can move from clinical evidence and assumptions through simulation and analysis while maintaining visibility into how the model operates and how its conclusions are reached.
The goal is not complexity for its own sake. It is to build models that are sufficiently sophisticated to address the decision problem, yet understandable, reviewable, and defensible enough to support confident decision-making.
Illustrative model note: The colorectal cancer screening model and its parameter values were developed to demonstrate modeling and analysis capabilities. The model has not been clinically validated, and its results should not be used to guide screening recommendations.
About TreeAge Pro Healthcare
TreeAge Pro Healthcare is a visual modeling and analysis platform for sophisticated health economic modeling. It supports decision trees, Markov models, patient-level simulation, discrete-event simulation, partitioned survival models, cost-effectiveness analysis, and sensitivity analysis—all within a flexible environment designed to make models understandable, reviewable, and defensible.