
Understand & Use Your Clinical Data
TreeAge Pro helps you explore and interpret clinical evidence, understand how risk changes over time, and translate that evidence into your model.
Source data can take many forms – Kaplan-Meier curves or tables, patient-level data, fitted distributions, published probabilities, hazard ratios, treatment effects, etc. Understanding what the evidence tells you is an important first step in building a defensible model.
TreeAge Pro provides tools to visualize and interpret clinical evidence, explore alternative representations, and use that evidence to drive disease progression within your model.
Kaplan-Meier Survival Data
Consider a common example – Kaplan-Meier Survival Data.
Kaplan-Meier data provides critical evidence about observed survival, but modelers often need to determine how that evidence should be represented—and how outcomes should be projected beyond the observed period—before using it to drive a model.
TreeAge Pro provides key tools for transforming that data, so it can be used in your model. TreeAge Pro can also use input data from regression analysis tools that you may prefer for fitting your data.
Survival to Hazard Converter
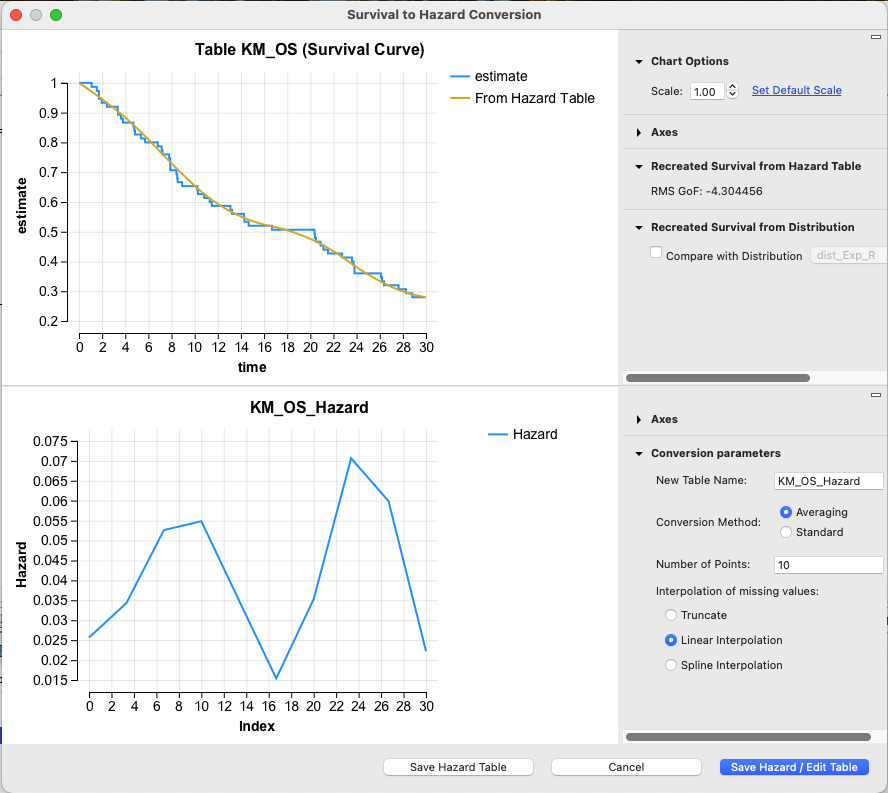
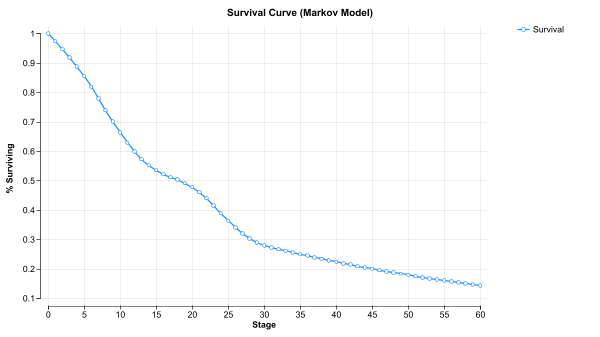
Convert survival data to hazard data to understand how risk changes over time and use those changing risks to drive disease progression in your model.
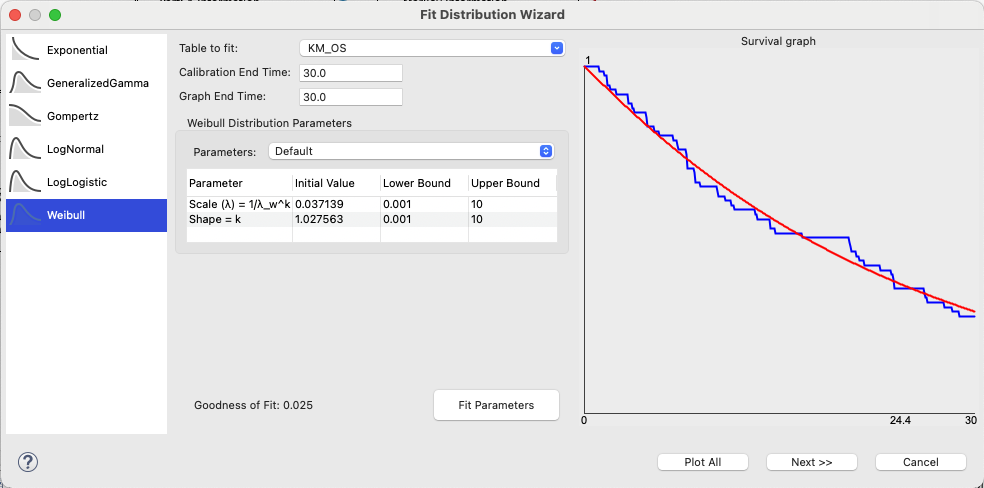
Fit Distribution to a Survival Table
TreeAge Pro’s curve-fitting algorithm matches the survival data to a distribution.
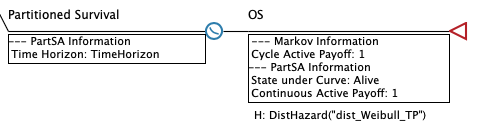
The fitted distribution can then drive disease progression in your model.
Use Fitted Distributions from Regression Analysis
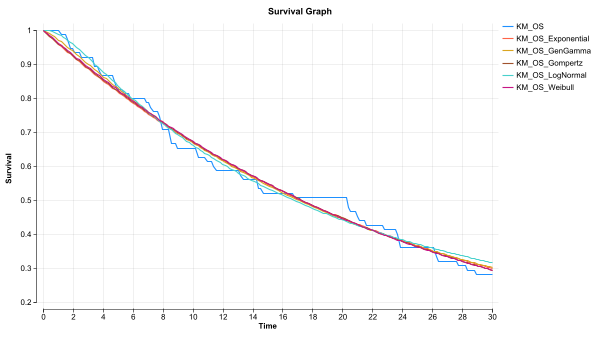
You might choose to use statistical regression analysis with SAS, Stata or R to fit distributions to your clinical data.
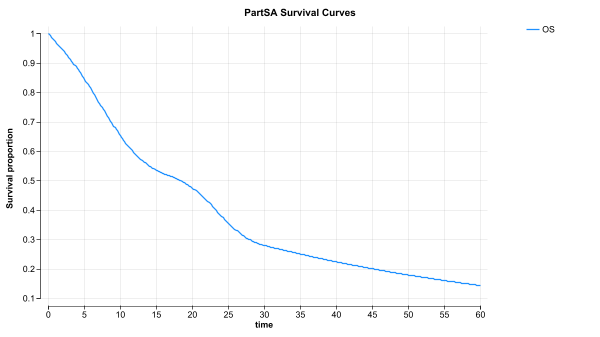
TreeAge Pro can help you visualize the fits of those distributions as well as the impact of extrapolation beyond the observed period.

What Does the Data Actually Represent?
How you represent the evidence is only part of the question. You also need to understand what the survival data represent.
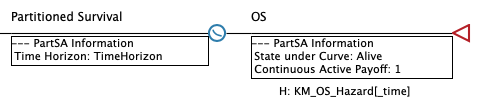
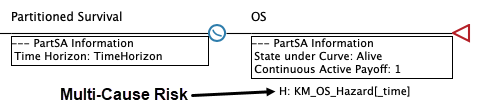
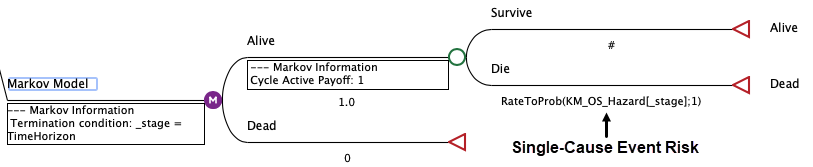
- Outcome-based evidence can lend itself naturally to approaches such as partitioned survival, where state membership is derived from survival outcomes.
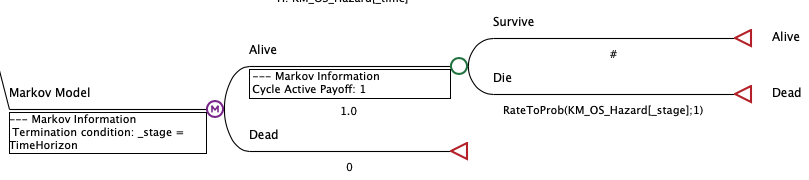
- Event-specific evidence can support models in which particular events explicitly drive transitions and subsequent consequences, such as Markov models, patient simulation, or discrete-event simulation.
TreeAge Pro’s framework supports all of those approaches.
Align Event-Driven Models with Survival
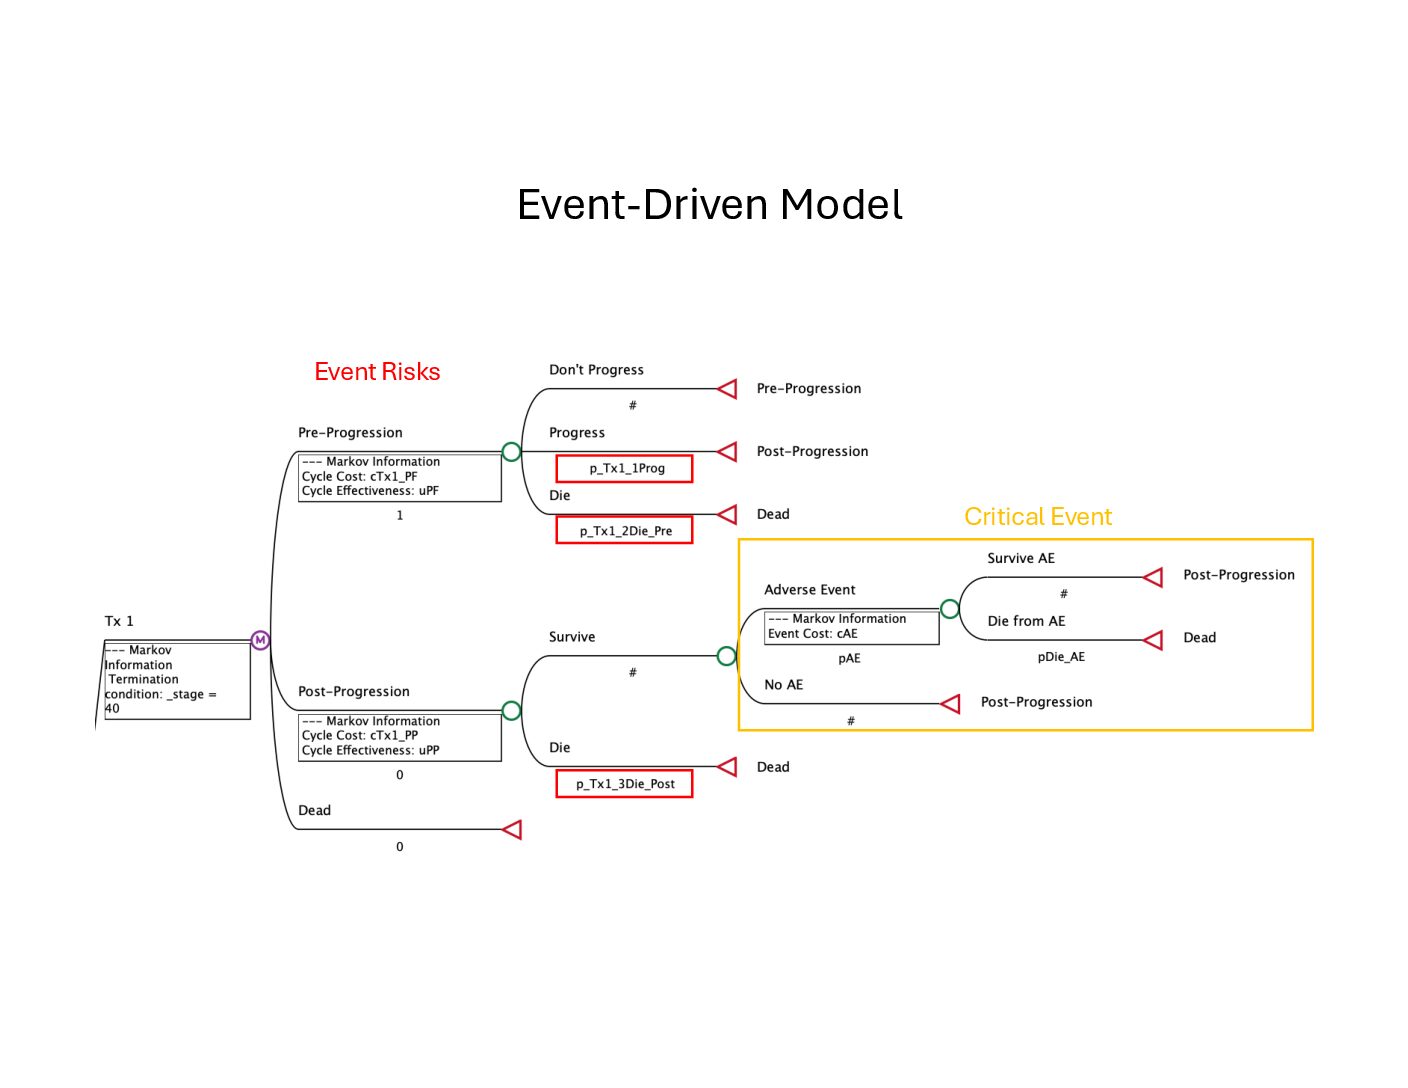
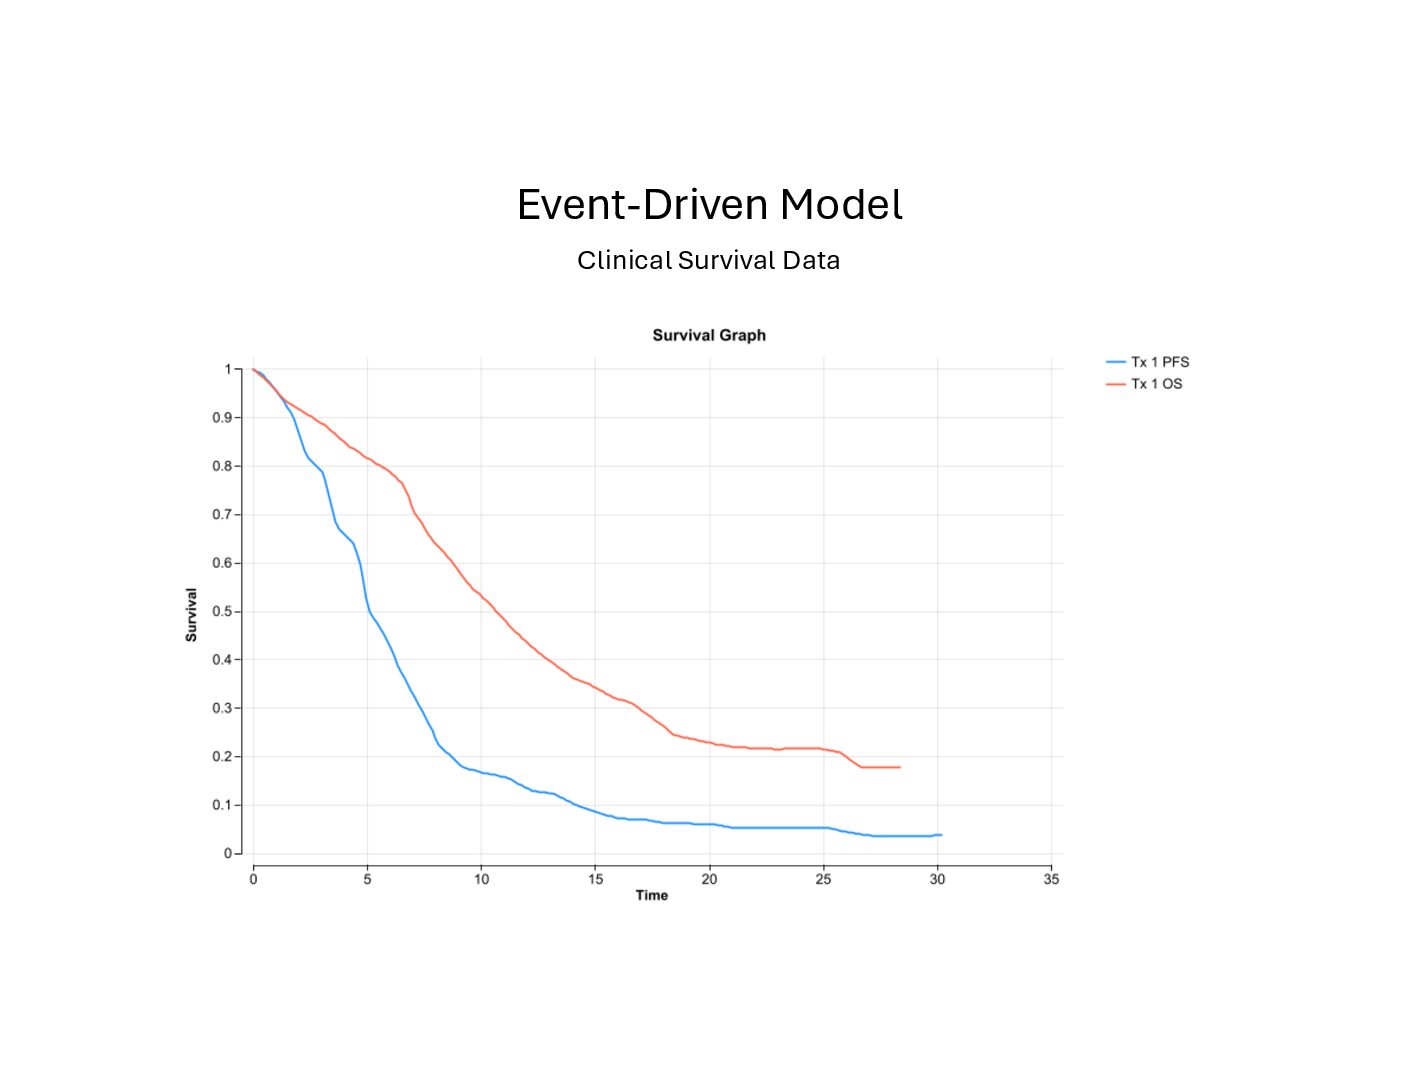
Your model may need explicit clinical events while your evidence is reported as survival outcomes.
An event-driven model may require risks for specific events, while the available clinical evidence reports broader survival outcomes. TreeAge Pro’s Calibration Tools can help refine those event risks so model behavior is consistent with the observed clinical evidence.
TreeAge Pro helps you understand your clinical evidence, determine how to represent it, and use it to drive disease progression in the modeling approach that fits your problem.
Want to see it in action?
Watch the webinar and then download the models to try them for yourself.