
Understanding Health Economic Models: From Structure to Validation
1. Why Model Understanding Matters
Health economic models inform treatment evaluation, reimbursement decisions, and healthcare resource allocation. They combine clinical evidence, assumptions about disease progression and treatment effects, costs, and health outcomes to estimate the consequences of alternative strategies.
The value of a health economic model depends not only on the results it produces, but also on our ability to inspect its structure, investigate its calculations, and understand how those results were generated.
A model may produce reasonable-looking results while containing incorrect assumptions, implementation errors, or unexpected behavior. Final cost-effectiveness results alone may not reveal these problems. Modelers need to understand how the clinical problem is represented, how calculations are performed, and how assumptions influence outcomes.
This need extends beyond the original developer. Colleagues may modify or extend a model, clients may want to understand its conclusions, and independent reviewers may need to evaluate its structure, assumptions, and calculations.
As models incorporate more health states, competing events, patient characteristics, and treatment sequences, investigating behavior can become more challenging. Complexity itself is not the problem. The challenge is maintaining the ability to inspect and understand the model as complexity increases.
2. Understanding Model Structure and Logic
Understanding a health economic model begins with understanding how it represents the clinical problem. Structure defines the health states, clinical events, decisions, and treatment pathways included in an analysis, along with the logic connecting them.
A three-state Markov model, for example, might represent progression-free disease, progressed disease, and death. Understanding it involves more than identifying those states. A reviewer needs to examine what determines transitions, how treatment effects enter calculations, where costs and outcomes accrue, and what assumptions govern the timing of events.
The Value of Visual Model Structure
Graphical representations can make model structure more accessible by allowing modelers and reviewers to visually inspect how health states, decisions, events, and pathways are connected. In TreeAge Pro Healthcare, users can navigate a graphical model and investigate the logic associated with its components.
However, seeing a model’s structure is not the same as fully understanding how it works. A diagram may show the possible transitions without revealing how their probabilities change over time, or identify where costs accrue without showing their values across cycles. Understanding therefore requires inspection of calculations, intermediate results, and model behavior.
3. Understanding Model Behavior: Markov Cohort Models
Markov cohort models distribute a population across health states, with transitions occurring over successive cycles. While graphical structure shows the possible transitions, cycle-by-cycle results help explain how the model behaves.
Examining the Markov Cohort Trace
TreeAge Pro Healthcare’s Markov Cohort Trace allows modelers to inspect state membership, calculations, costs, effectiveness, and other outcomes across cycles. Our example contains Pre-Progression, Post-Progression, and Dead states, with progression, mortality, and adverse-event pathways.
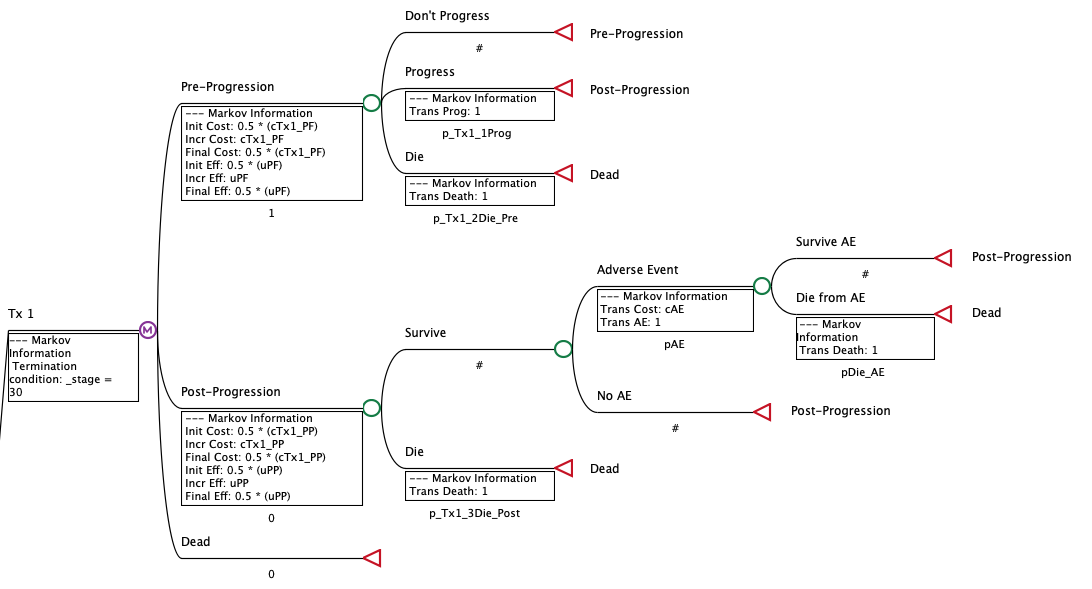
Figure 1. Graphical structure of the three-state Markov model, showing progression, mortality, and adverse-event pathways, with additional outcomes assigned to track clinical events.
The Markov Cohort Extended Report provides a hierarchical view of overall results and the individual states and transitions contributing to them. Modelers can investigate whether changes in state membership and accumulated outcomes follow the intended logic rather than relying solely on aggregate totals.
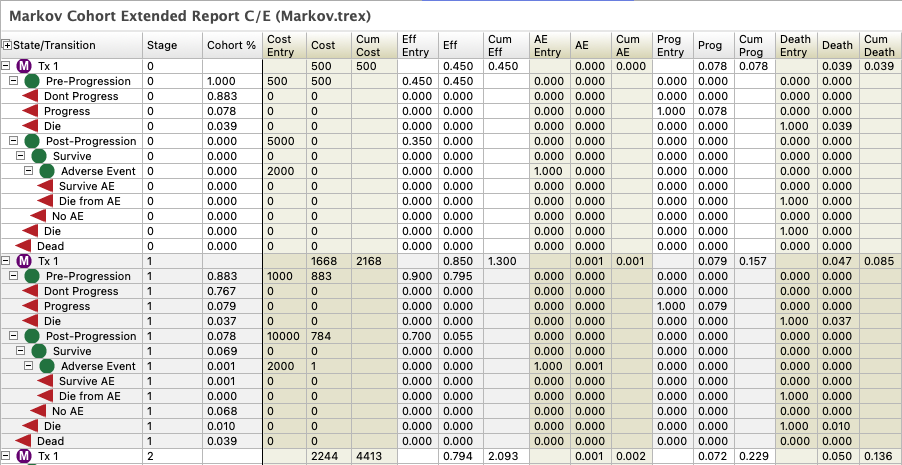
Figure 2. Markov Cohort Extended Report showing state membership, individual transitions, accumulated costs and effectiveness, and diagnostic outcomes for progression, adverse events, and deaths.
Adding Diagnostic Outcomes
In this example, additional outcomes track progression, adverse events, and deaths. These diagnostic quantities make visible events that may not correspond directly to persistent health states. For example, progression events in a given cycle are not necessarily equal to occupancy of the Post-Progression state; adverse events can occur without defining a separate Markov state.
Tracking these outcomes alongside state membership helps investigate clinical pathways and check whether event logic behaves as intended. Comparisons must account for the model’s cycle timing and outcome accumulation conventions. Models can be designed from the outset to support inspection, rather than adding diagnostic outputs only after an unexpected result appears.
Visualizing Model Behavior
Graphical views complement the detailed report. In the example, a Markov Plot compares model-generated progression-free survival (PFS) and overall survival (OS) with clinical target curves. Differences between predictions and targets identify periods worth investigating in the trace and transition calculations; they do not, by themselves, establish the cause of a discrepancy.
A Markov Calc Plot can provide a further perspective by showing how transition probabilities or other calculated quantities change across cycles. Together, these views connect model structure, intermediate calculations, and predicted outcomes.
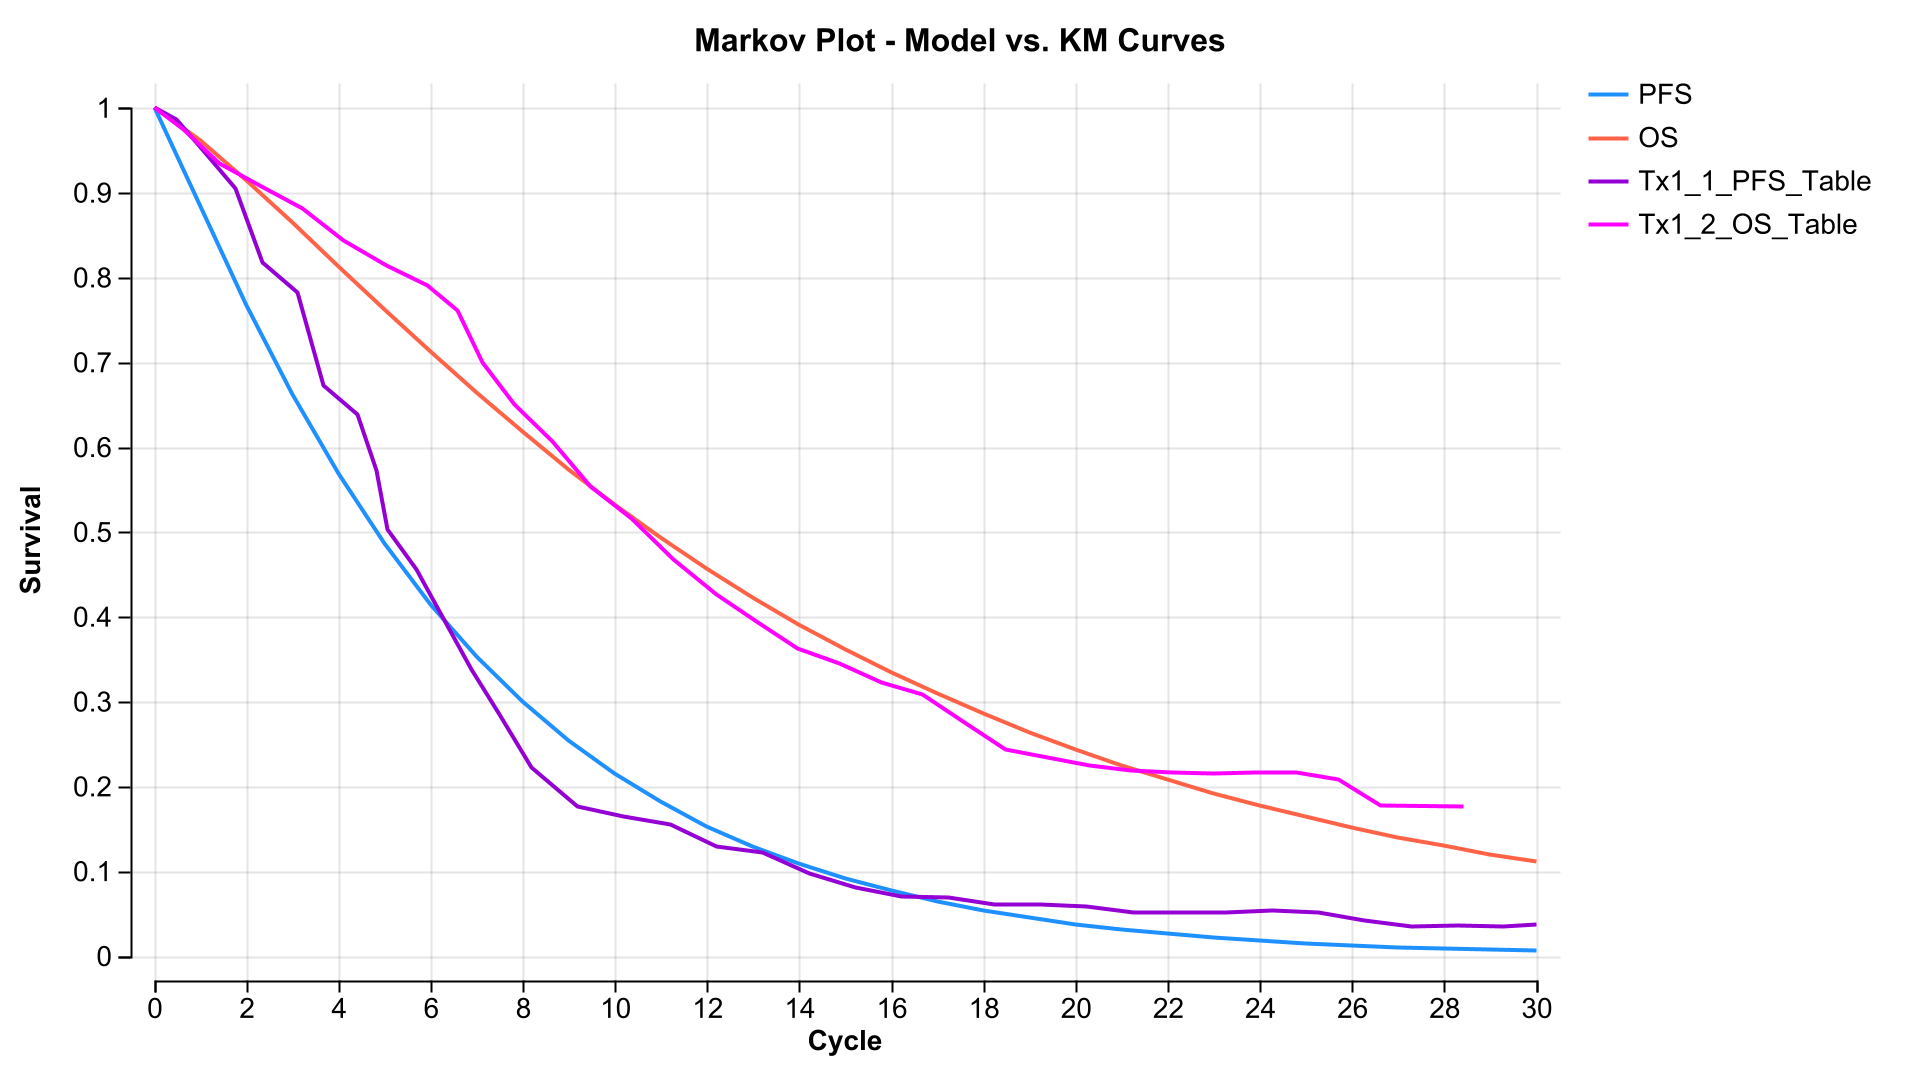
Figure 3. Comparison of model-generated PFS (blue) and OS (orange) with clinical survival targets (purple and magenta). Differences between the curves can help identify periods where model behavior warrants further investigation.
4. Understanding Survival Assumptions: Partitioned Survival Models
Partitioned survival analysis (PartSA) provides a useful contrast. In a conventional three-state PartSA model, PFS directly determines the progression-free proportion, OS determines the proportion alive, and OS minus PFS determines the progressed proportion. The proportion dead is one minus OS. The fitted survival functions therefore drive state membership directly rather than arising from transitions between states.
Inspecting the PartSA Model Structure
The TreeAge Pro Healthcare model shown below represents two treatment strategies, each with separate PFS and OS branches. Its graphical structure allows modelers to inspect which survival functions are used and where costs and effectiveness are calculated.
This provides a starting point for understanding how the model translates survival assumptions into clinical and economic outcomes.
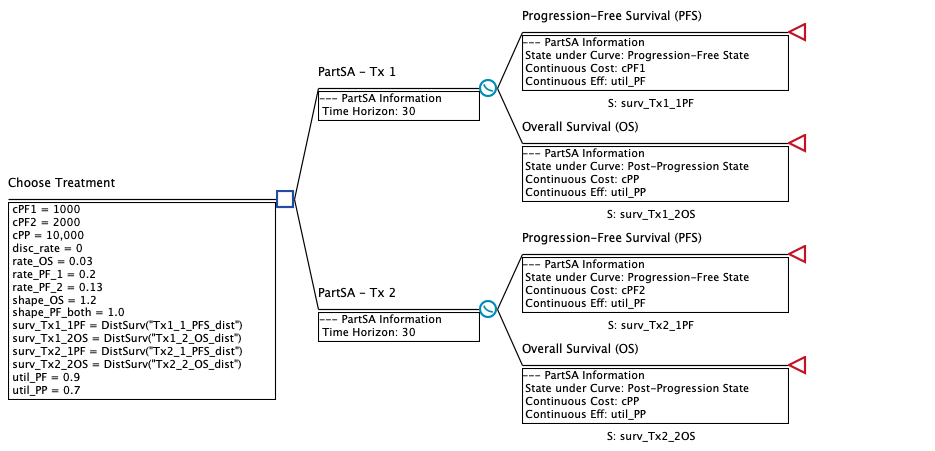
Figure 4. PartSA model structure showing PFS and OS survival functions for two treatment strategies.
Inspecting the Fitted Survival Distributions
Once the survival functions have been identified in the model, the next step is to examine the evidence and assumptions underlying them.
TreeAge Pro Healthcare’s Survival Plot allows modelers to compare fitted distributions with the original survival data and inspect how those distributions behave beyond the observed period.
Figure 5 shows the PFS and OS survival tables for Tx1 alongside their fitted distributions. Both distributions broadly reproduce the observed survival patterns, although some differences are visible. The fitted curves also extend substantially beyond the available data, making their long-term extrapolations available for inspection.
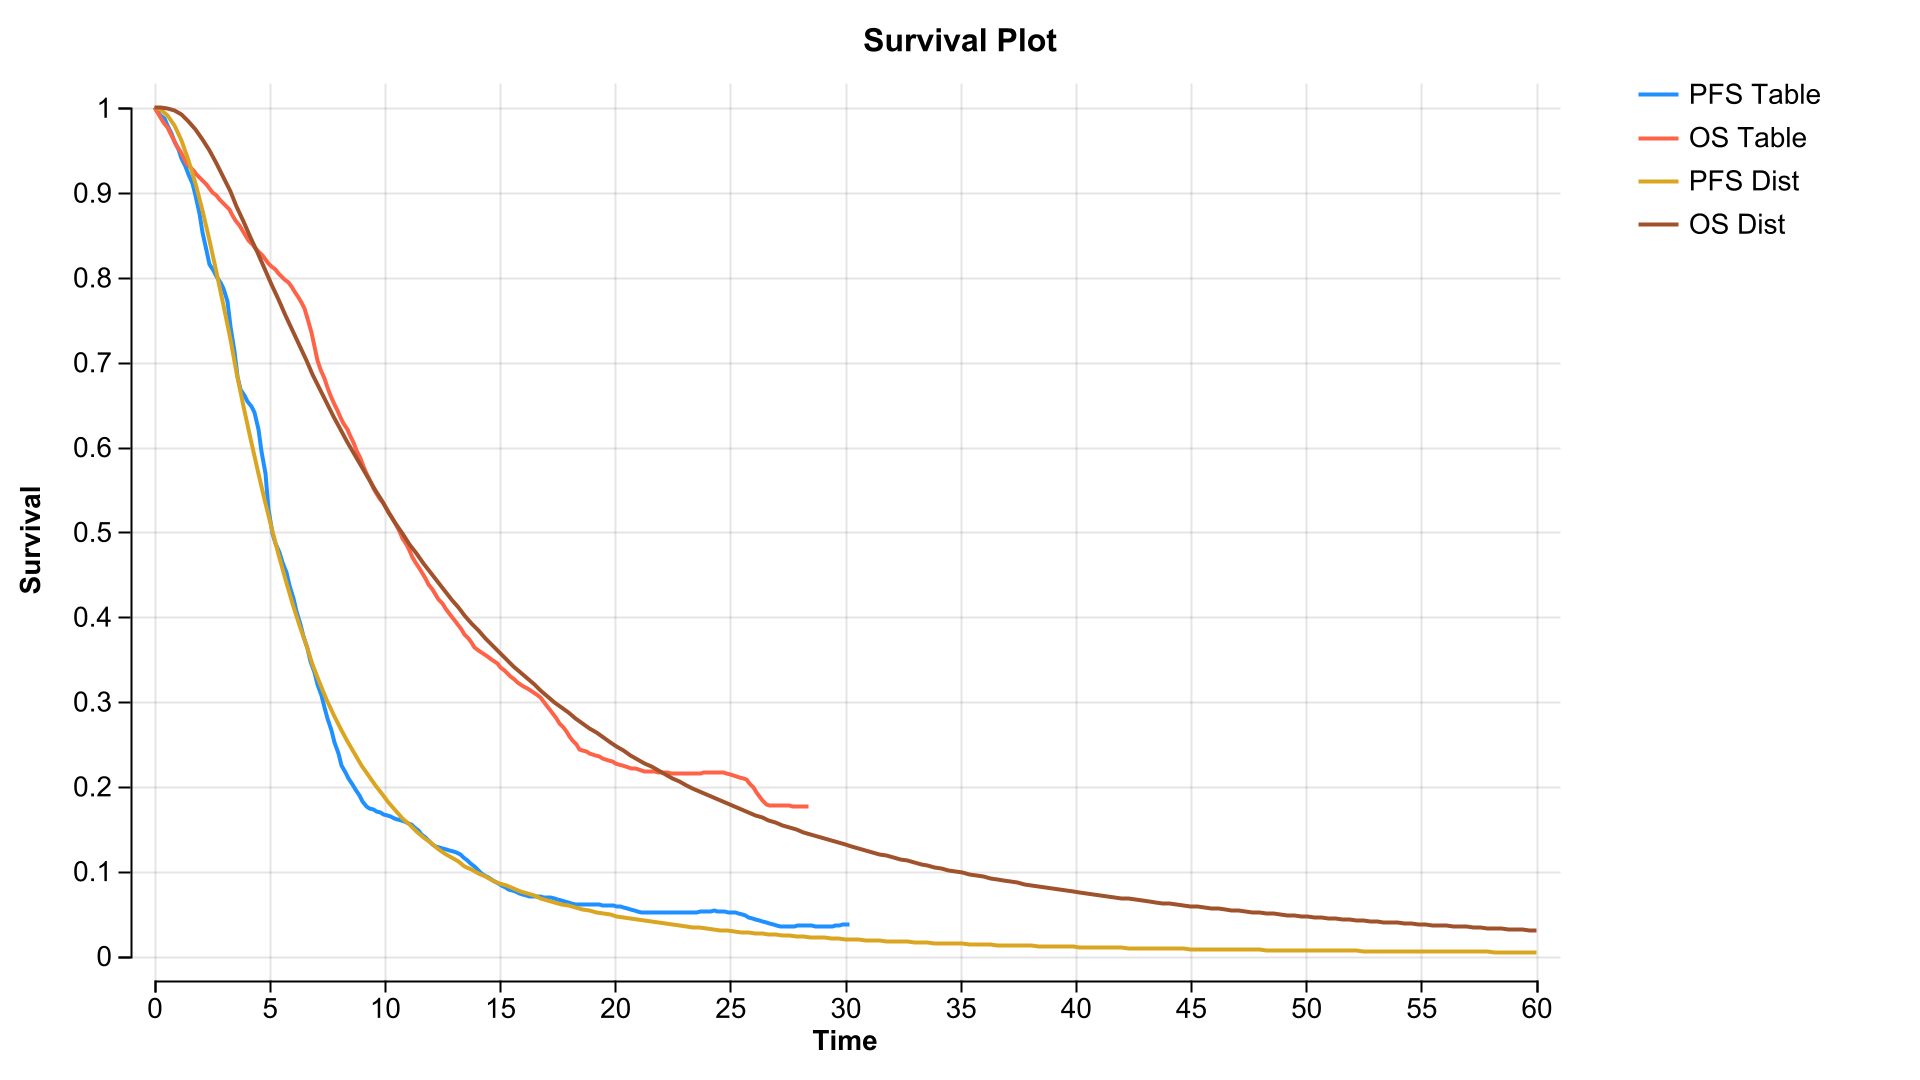
Figure 5. PFS and OS survival tables compared with their fitted distributions and long-term extrapolations.
Inspecting the Implied Hazards
The corresponding Hazard Plot reveals a potentially important issue not readily apparent from the survival curves. In this example, the fitted overall-survival hazard rises initially but then declines through the later extrapolation period.
For an aging patient population, continued decline in the implied overall mortality hazard raises a question about long-term clinical plausibility. A declining hazard is not automatically incorrect: disease dynamics and survivor selection may influence its shape. Nevertheless, the modeler should investigate the patient population, alternative distributions, and the treatment of background mortality.
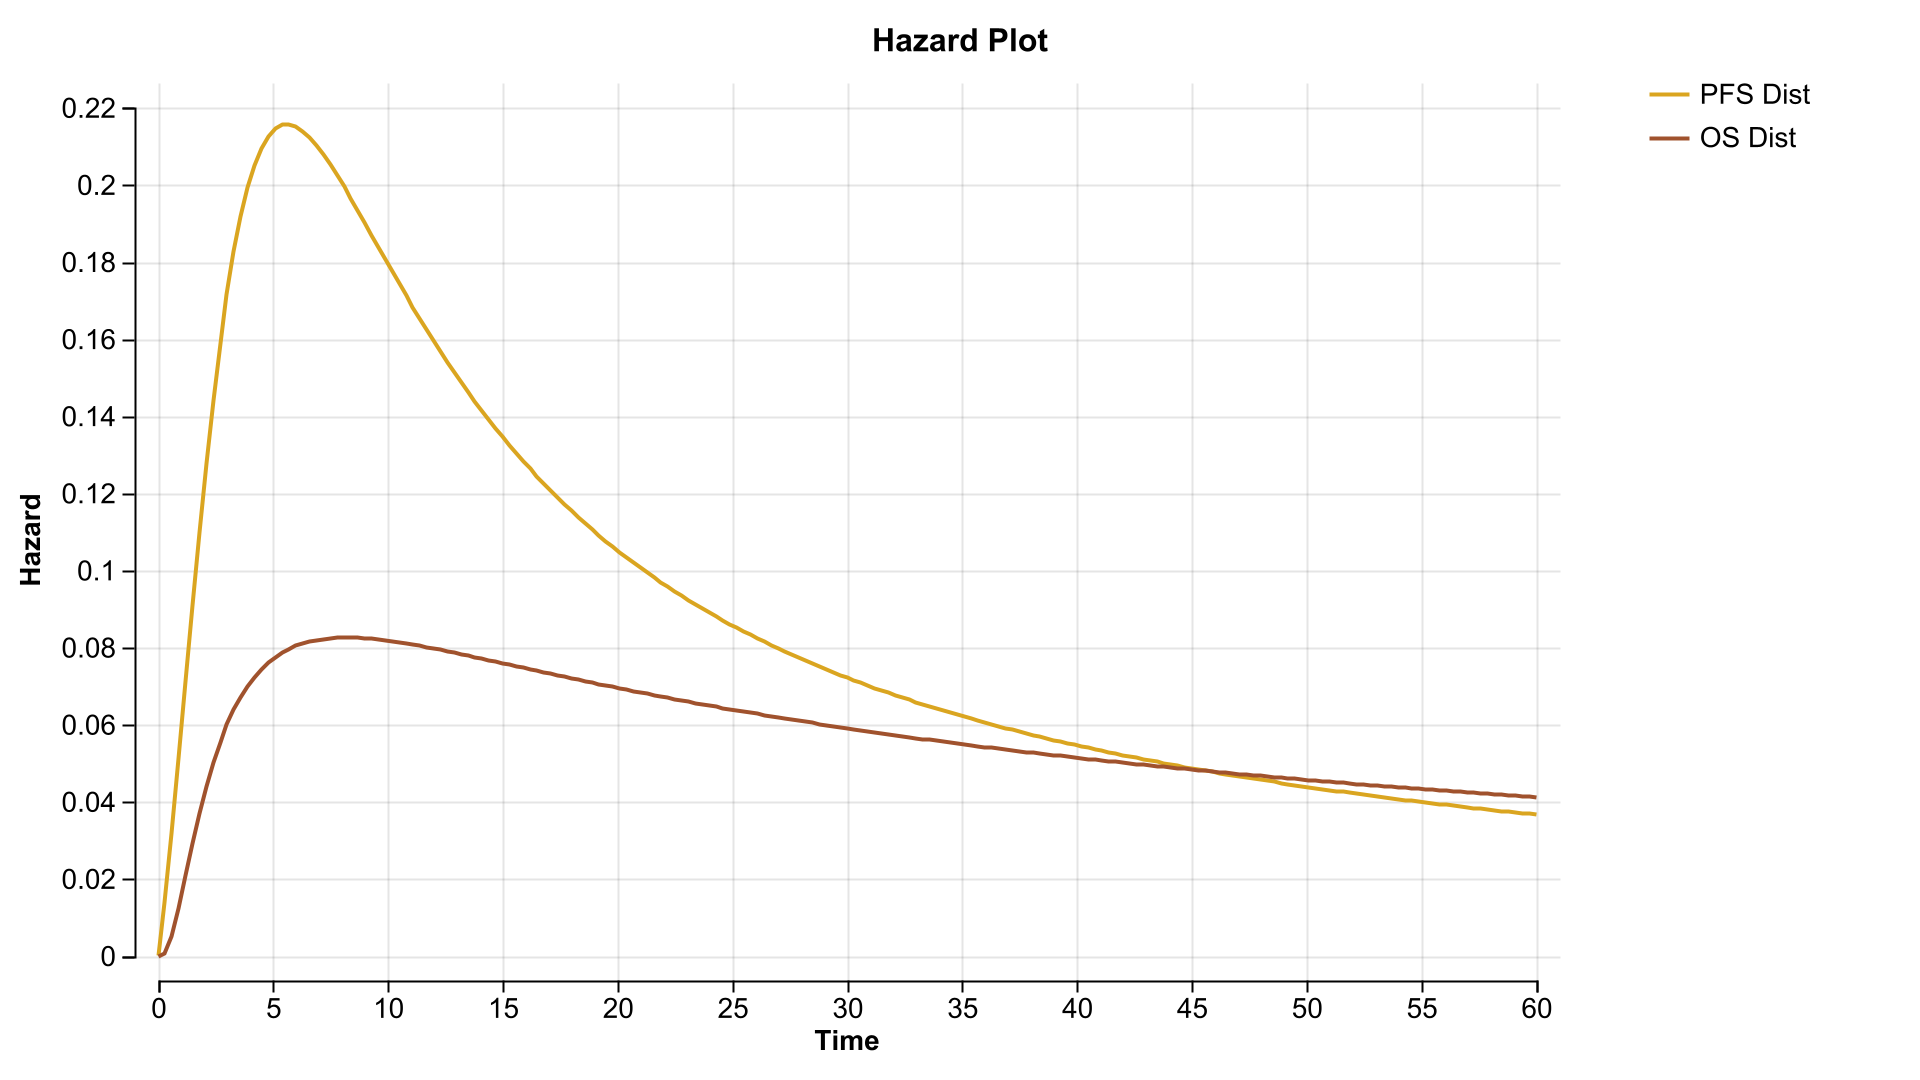
Figure 6. Hazard functions for the fitted Tx1 PFS and OS distributions, showing declining hazards during long-term extrapolation.
The comparison illustrates why inspection should go beyond confirming that a distribution fits the observed survival data. A fitted function may look reasonable on a survival plot while implying long-term hazard behavior that warrants further evaluation.
5. Understanding Individual Patient Pathways: Simulation Models
Individual patient simulations can represent patient characteristics, screening decisions, disease progression, and events occurring at different times. Aggregate results summarize outcomes across simulated patients, but may not explain the pathway and calculations behind a particular patient’s experience.
Inspecting the Model Structure
The colorectal cancer screening model introduced in our earlier article on sophisticated health economic modeling provides an example. Its graphical structure shows how screening decisions, clinical events, and patient characteristics influence individual pathways. Patient tracking and calculation tracing then allow modelers to investigate how these pathways are followed during simulation.
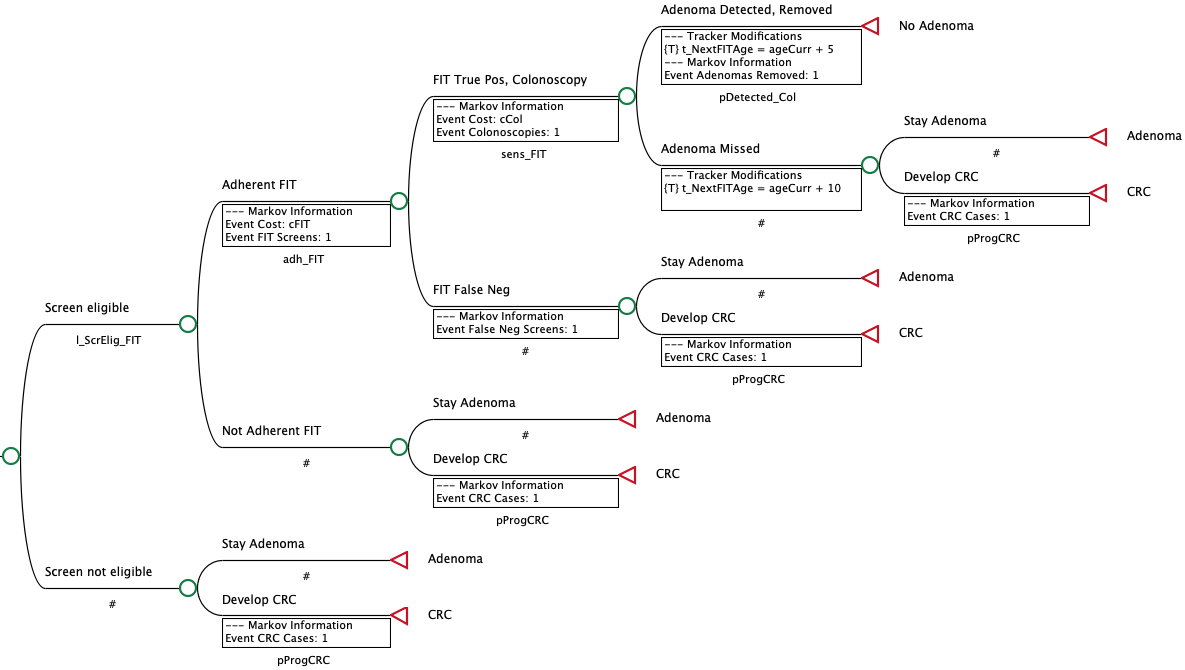
Figure 7. Colorectal cancer screening model showing patient pathways, clinical events, and tracker modifications during simulation.
Following Individual Patient Histories
TreeAge Pro Healthcare’s Patient Tracking Trial Report shows the states, transitions, events, and accumulated outcomes of individual simulated patients. In the example, a patient beginning at age 50 undergoes FIT screening followed by colonoscopy after a false-positive result, then remains in the No Adenoma state over the subsequent cycles shown.
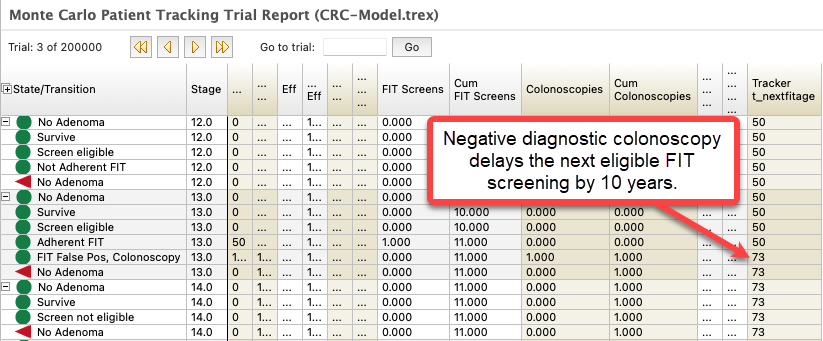
Figure 8. Patient Tracking Trial Report showing how a negative diagnostic colonoscopy delays subsequent screening eligibility through an updated patient tracker.
Following this history allows the modeler to inspect the timing of screening, the clinical pathway, and associated costs and effectiveness rather than infer them from population averages. In this example, a negative diagnostic colonoscopy delays the patient’s next eligible FIT screening by ten years, as reflected in the updated tracker value.
Investigating the Calculations
The Calculation Trace Console provides another level of inspection by showing individual calculations and the variable values used to evaluate them. In this model, screening eligibility depends on current age, prior screening history, and the timing of the next screening opportunity. Inspecting those inputs helps explain why a screening condition evaluates as it does.
The calculation trace reveals how individual variable values contribute to a decision. In this example, screening eligibility changes between successive model stages as the patient’s current age and next eligible screening age are evaluated. Examining these calculations helps modelers understand why a particular pathway is followed and investigate unexpected behavior.
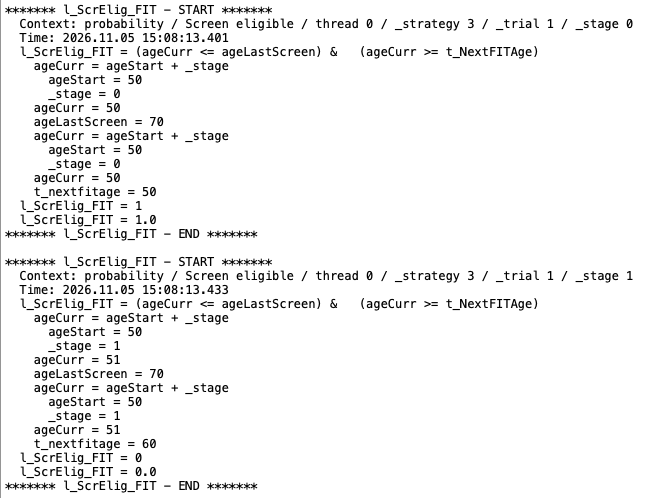
Figure 9. Calculation Trace Console showing the variables and logical conditions used to determine screening eligibility during simulation.
A single patient history cannot establish that the full simulation is valid. Targeted traces are most useful alongside aggregate results and broader tests of model behavior.
6. Understanding, Validation, and Independent Review
Supporting Verification and Validation
The ability to inspect model structure, calculations, and behavior is important not only during model development, but also for verification, validation, and independent review.
Verification examines whether the model has been implemented correctly according to its intended design. This includes checking calculations, transition logic, event assignments, and the accumulation of costs and outcomes.
Validation examines whether the model appropriately represents the clinical problem and produces behavior and results that are credible in light of available evidence and expert understanding.
The examples in this article illustrate how different investigative techniques contribute to these activities.
In Markov cohort models, examining state membership, transitions, and diagnostic outcomes can help identify implementation errors and unexpected behavior. In partitioned survival models, inspecting fitted survival distributions and their implied hazards can reveal assumptions that warrant further investigation. In individual patient simulations, patient histories and calculation traces allow modelers to investigate the decisions and events that determine particular pathways.
These techniques are complementary. No single report or graphical view can establish that a model is correct or valid. Rather, each provides evidence that can be considered alongside other verification and validation activities.
Supporting Independent Review
The ability to inspect a model is also important for researchers and reviewers who were not involved in its original development.
A reviewer may need to understand how the model represents disease progression, identify the assumptions underlying its calculations, or investigate why particular outcomes occur.
Graphical model structures, intermediate results, and calculation reports provide different ways to examine these questions.
However, access to these tools does not automatically make a model transparent or easy to review. Modelers must also organize their models clearly, document important assumptions, and provide sufficient information for others to interpret the results.
Designing models with inspection and review in mind, supported by clear organization, documentation, and accessible intermediate calculations, makes it easier to investigate model behavior throughout development and independent review.
A model that can be systematically inspected is better positioned to support meaningful verification, validation, communication, and independent review.
7. Conclusion: Models That Can Be Understood and Reviewed
Health economic models must do more than generate results. They must also provide a basis for understanding how those results were produced, evaluating the assumptions behind them, and assessing whether the model behaves as intended.
As models become more complex, maintaining this understanding requires deliberate attention to model structure, calculations, and intermediate outcomes.
The examples in this article demonstrate how different modeling approaches require different methods of inspection. Markov cohort traces reveal how model behavior develops over time. Survival and hazard plots help investigate assumptions underlying partitioned survival models. Individual patient tracking and calculation traces allow modelers to examine the events and calculations within complex simulations.
These techniques do not replace careful model development, documentation, or formal validation. They make those activities more effective by providing ways to investigate model behavior and identify questions that might otherwise remain unanswered.
TreeAge Pro Healthcare brings together visual model development, detailed calculation reports, diagnostic outputs, and tools for investigating model behavior within a single modeling environment.
The objective is not simply to build models capable of representing complex clinical problems, but to ensure that those models can also be inspected, understood, validated, and independently reviewed.
About TreeAge Pro Healthcare
TreeAge Pro Healthcare is a visual modeling and analysis platform for sophisticated health economic modeling. It supports decision trees, Markov models, patient-level simulation, discrete-event simulation, partitioned survival models, cost-effectiveness analysis, and sensitivity analysis—all within a flexible environment designed to make models understandable, reviewable, and defensible.