Probabilistic Sensitivity Analysis
Understand the Combined Impact of Parameter Uncertainty on Model Results
Represent uncertain model inputs with probability distributions and sample them simultaneously to understand how combined parameter uncertainty affects model results.
Health economic models often contain many uncertain inputs, and their combined uncertainty may affect the range of possible model results. Probabilistic sensitivity analysis evaluates these uncertainties together, allowing you to examine the distribution of results and understand how parameter uncertainty affects cost-effectiveness outcomes and other model results.
TreeAge Pro provides integrated tools for defining parameter distributions, running probabilistic sensitivity analysis, and visualizing the resulting uncertainty.
Represent Uncertain Inputs with Probability Distributions
Define Uncertainty in Model Inputs
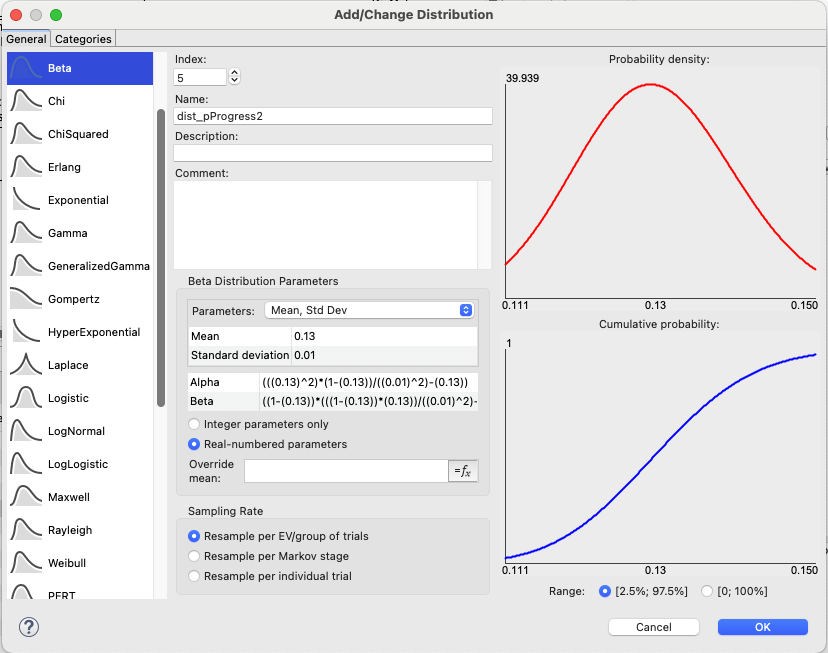
Assign probability distributions to uncertain model inputs to represent the range and relative likelihood of plausible parameter values.
Use Distributions Appropriate to Different Inputs
Define distributions for probabilities, costs, utilities, treatment effects, and other uncertain model inputs using the distribution options available in TreeAge Pro.
Sample Inputs During Probabilistic Sensitivity Analysis
During PSA, TreeAge Pro samples values from the defined distributions simultaneously and uses those sampled values to calculate model results for each iteration.
Run PSA and Explore the Distribution of Results
Evaluate Uncertainty Across Repeated Model Runs
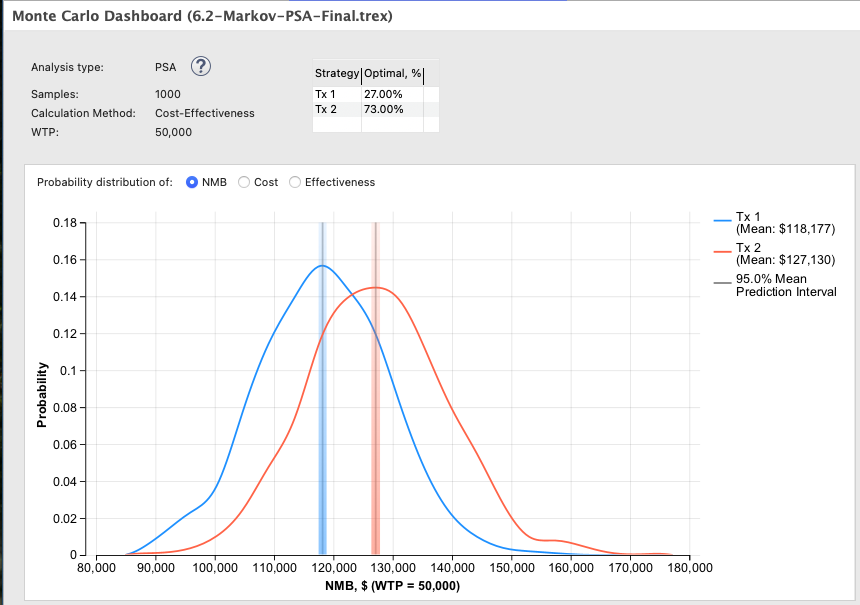
Run the model repeatedly while sampling uncertain inputs from their probability distributions. Each iteration uses a different combination of sampled input values to evaluate the model under parameter uncertainty.
Examine the Range and Distribution of Model Results
Review results across PSA iterations to understand the range and distribution of model results produced by the sampled parameter values.
Evaluate and Communicate Decision Uncertainty
Explore Uncertainty in Cost-Effectiveness Results
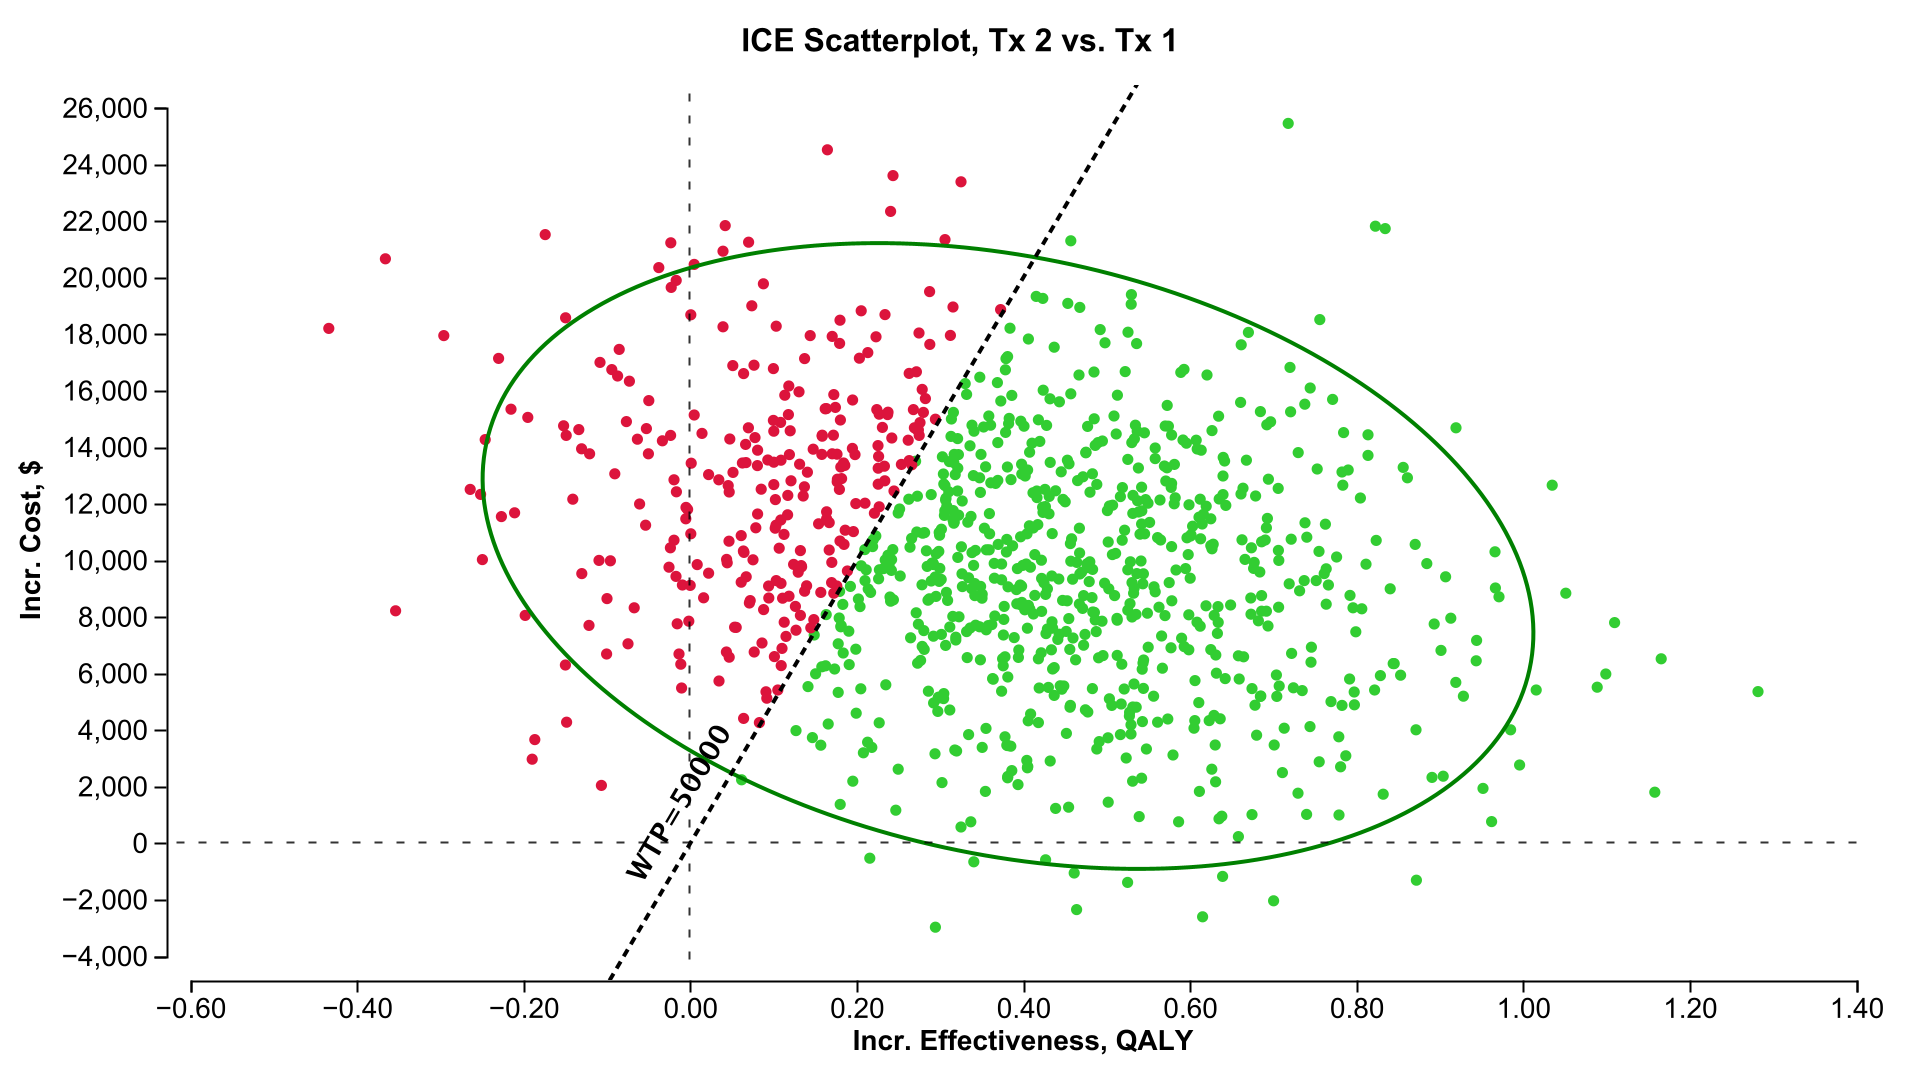
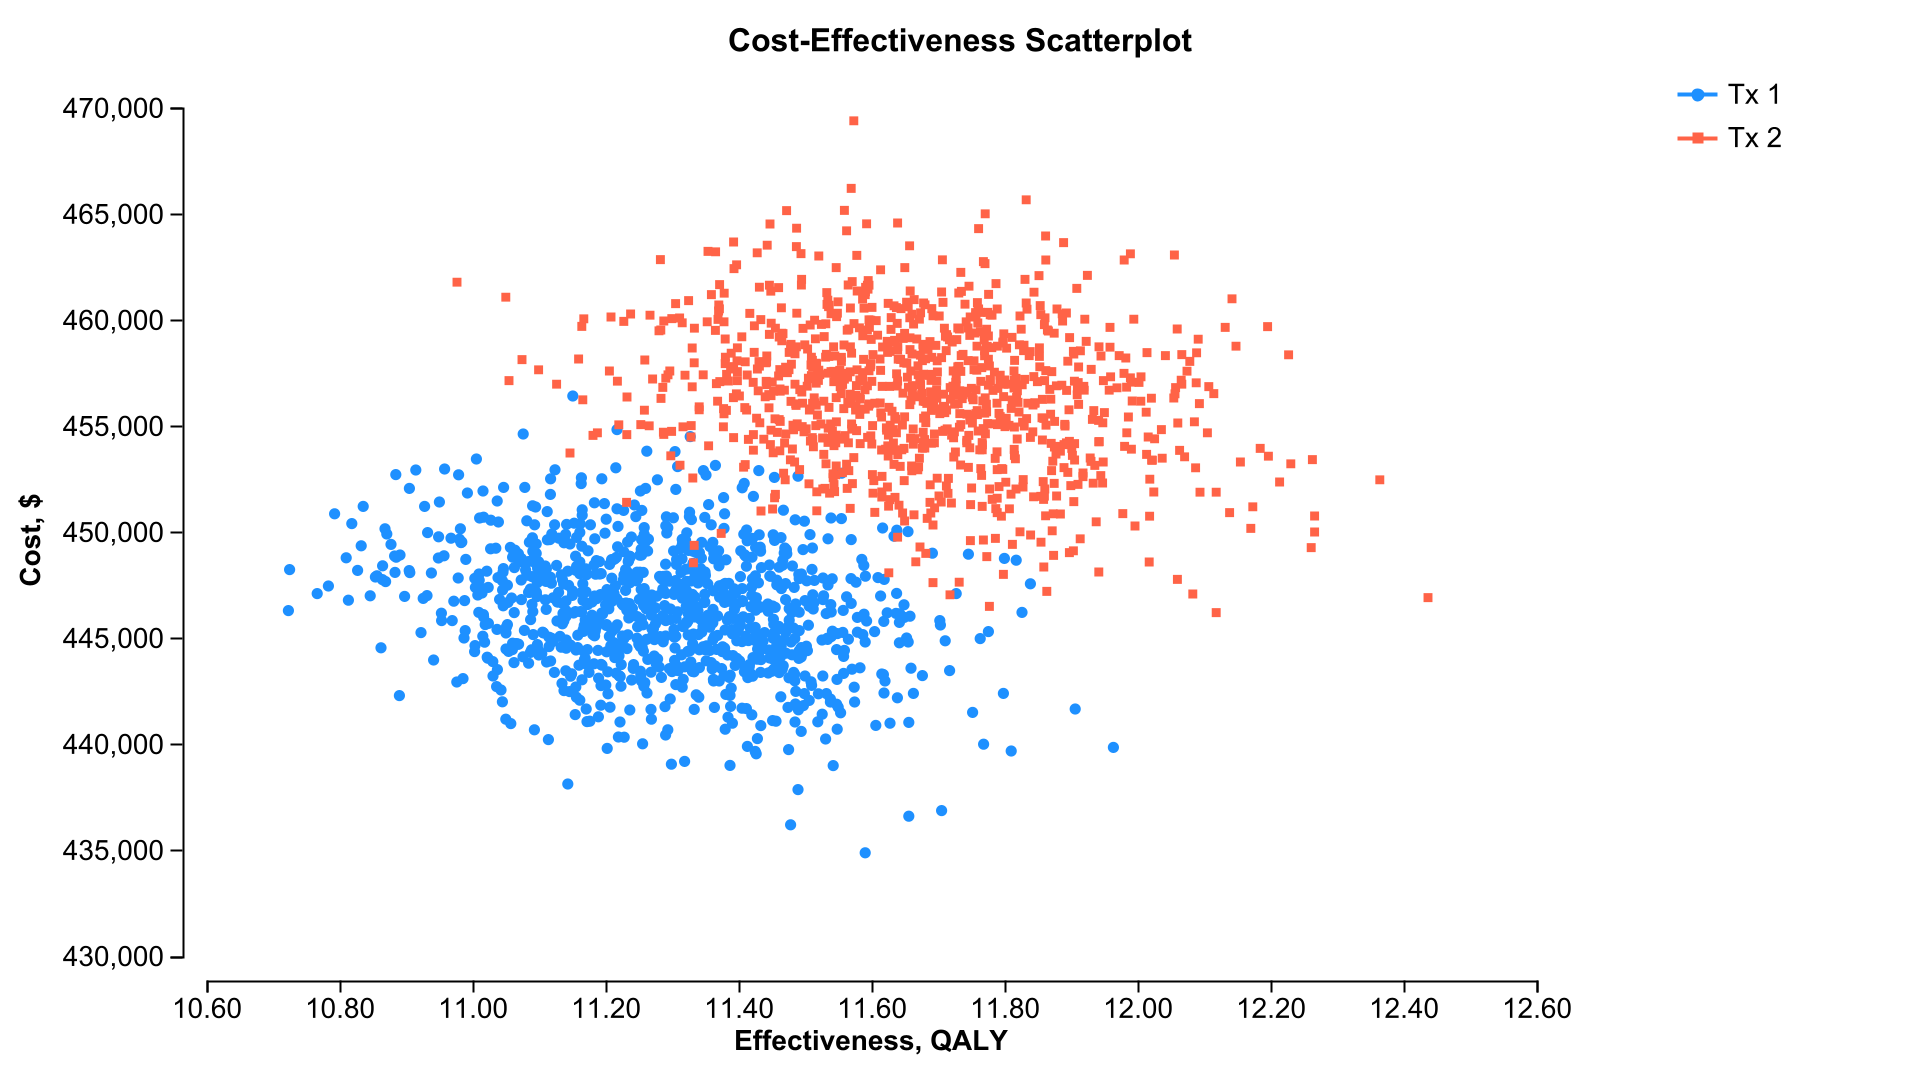
Use probabilistic cost-effectiveness results and visualizations to understand how parameter uncertainty affects the comparison among strategies. Incremental cost-effectiveness scatterplots show the distribution of simulated cost and effectiveness results.
Evaluate Results Across Willingness-to-Pay Thresholds
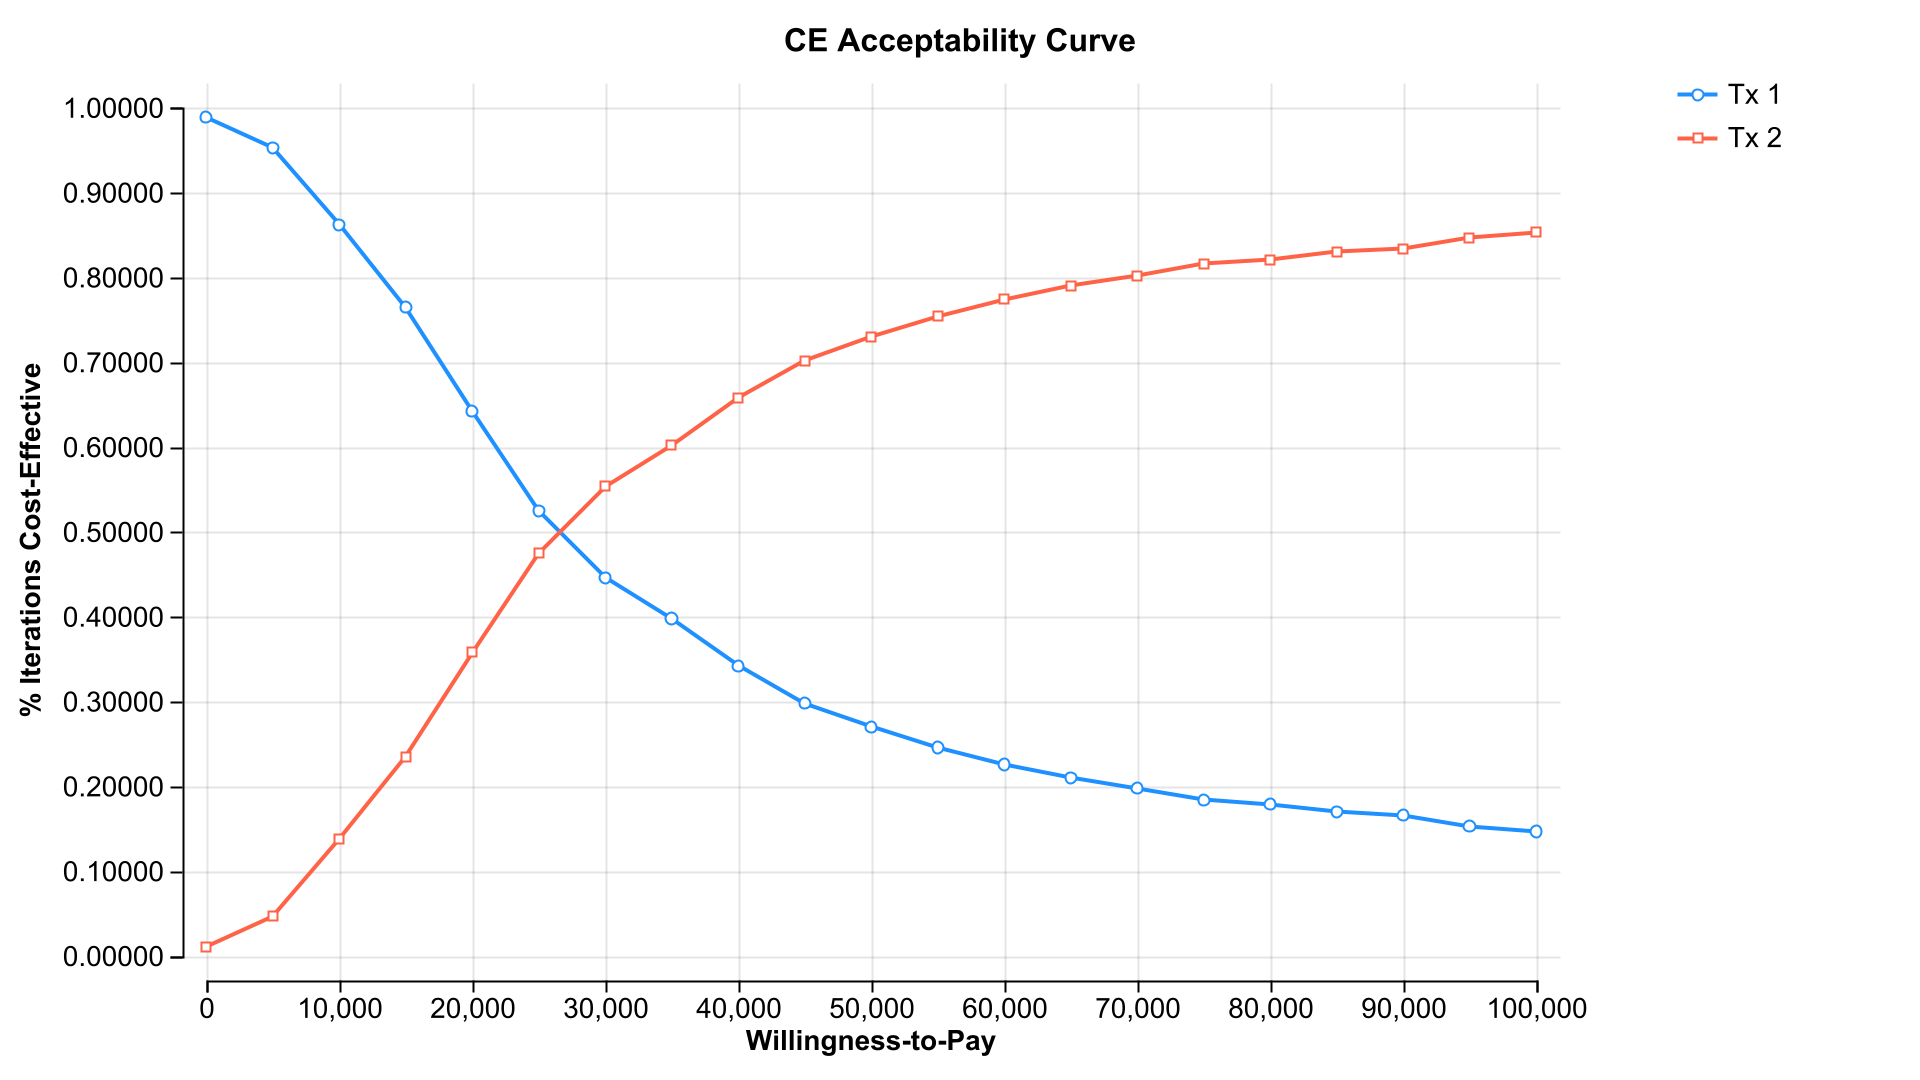
Use cost-effectiveness acceptability results to examine how the probability of each strategy being cost-effective changes across willingness-to-pay thresholds.
Communicate the Impact of Uncertainty
Use PSA reports and visualizations to communicate the range and distribution of results and help colleagues, clients, and reviewers understand how parameter uncertainty affects the model’s cost-effectiveness results.