
Continuous-Time Hazard Models, AI-Powered Help & Enhanced Sensitivity Analysis
TreeAge Pro Healthcare
TreeAge Pro 2027 R1 introduces continuous-time Hazard Models, an AI-powered help assistant, and enhancements to survival analysis, sensitivity analysis, and model visualization. These new capabilities help researchers build sophisticated health economic models, explore clinical evidence, and better understand model behavior.
AI-Powered Help Assistant
Get guidance on building and analyzing models directly within TreeAge Pro.
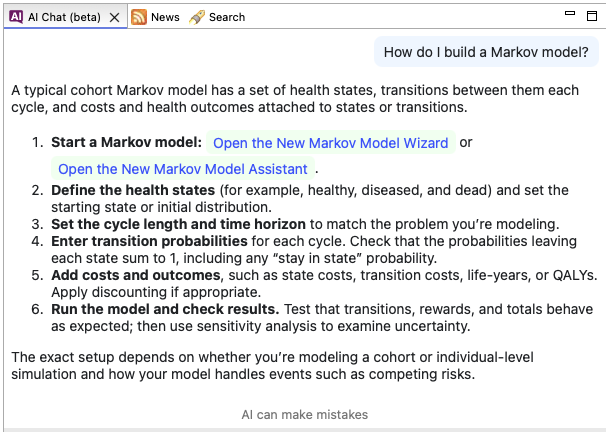
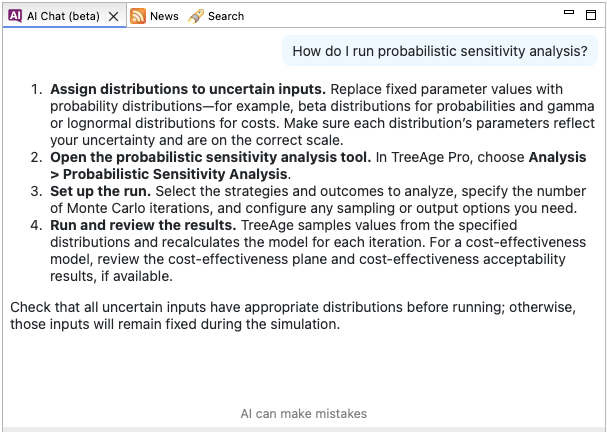
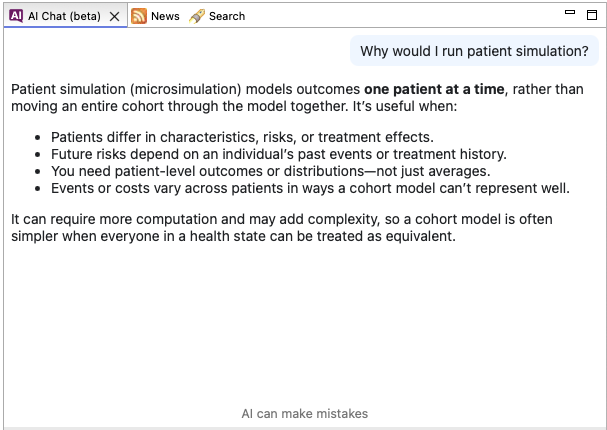
The new AI-powered chat assistant allows users to ask questions in natural language and receive guidance based primarily on TreeAge Pro’s existing help documentation. It provides a convenient way to find relevant information, understand modeling features, and learn how to use TreeAge Pro’s capabilities without leaving the software.
Continuous-Time Hazard Models *
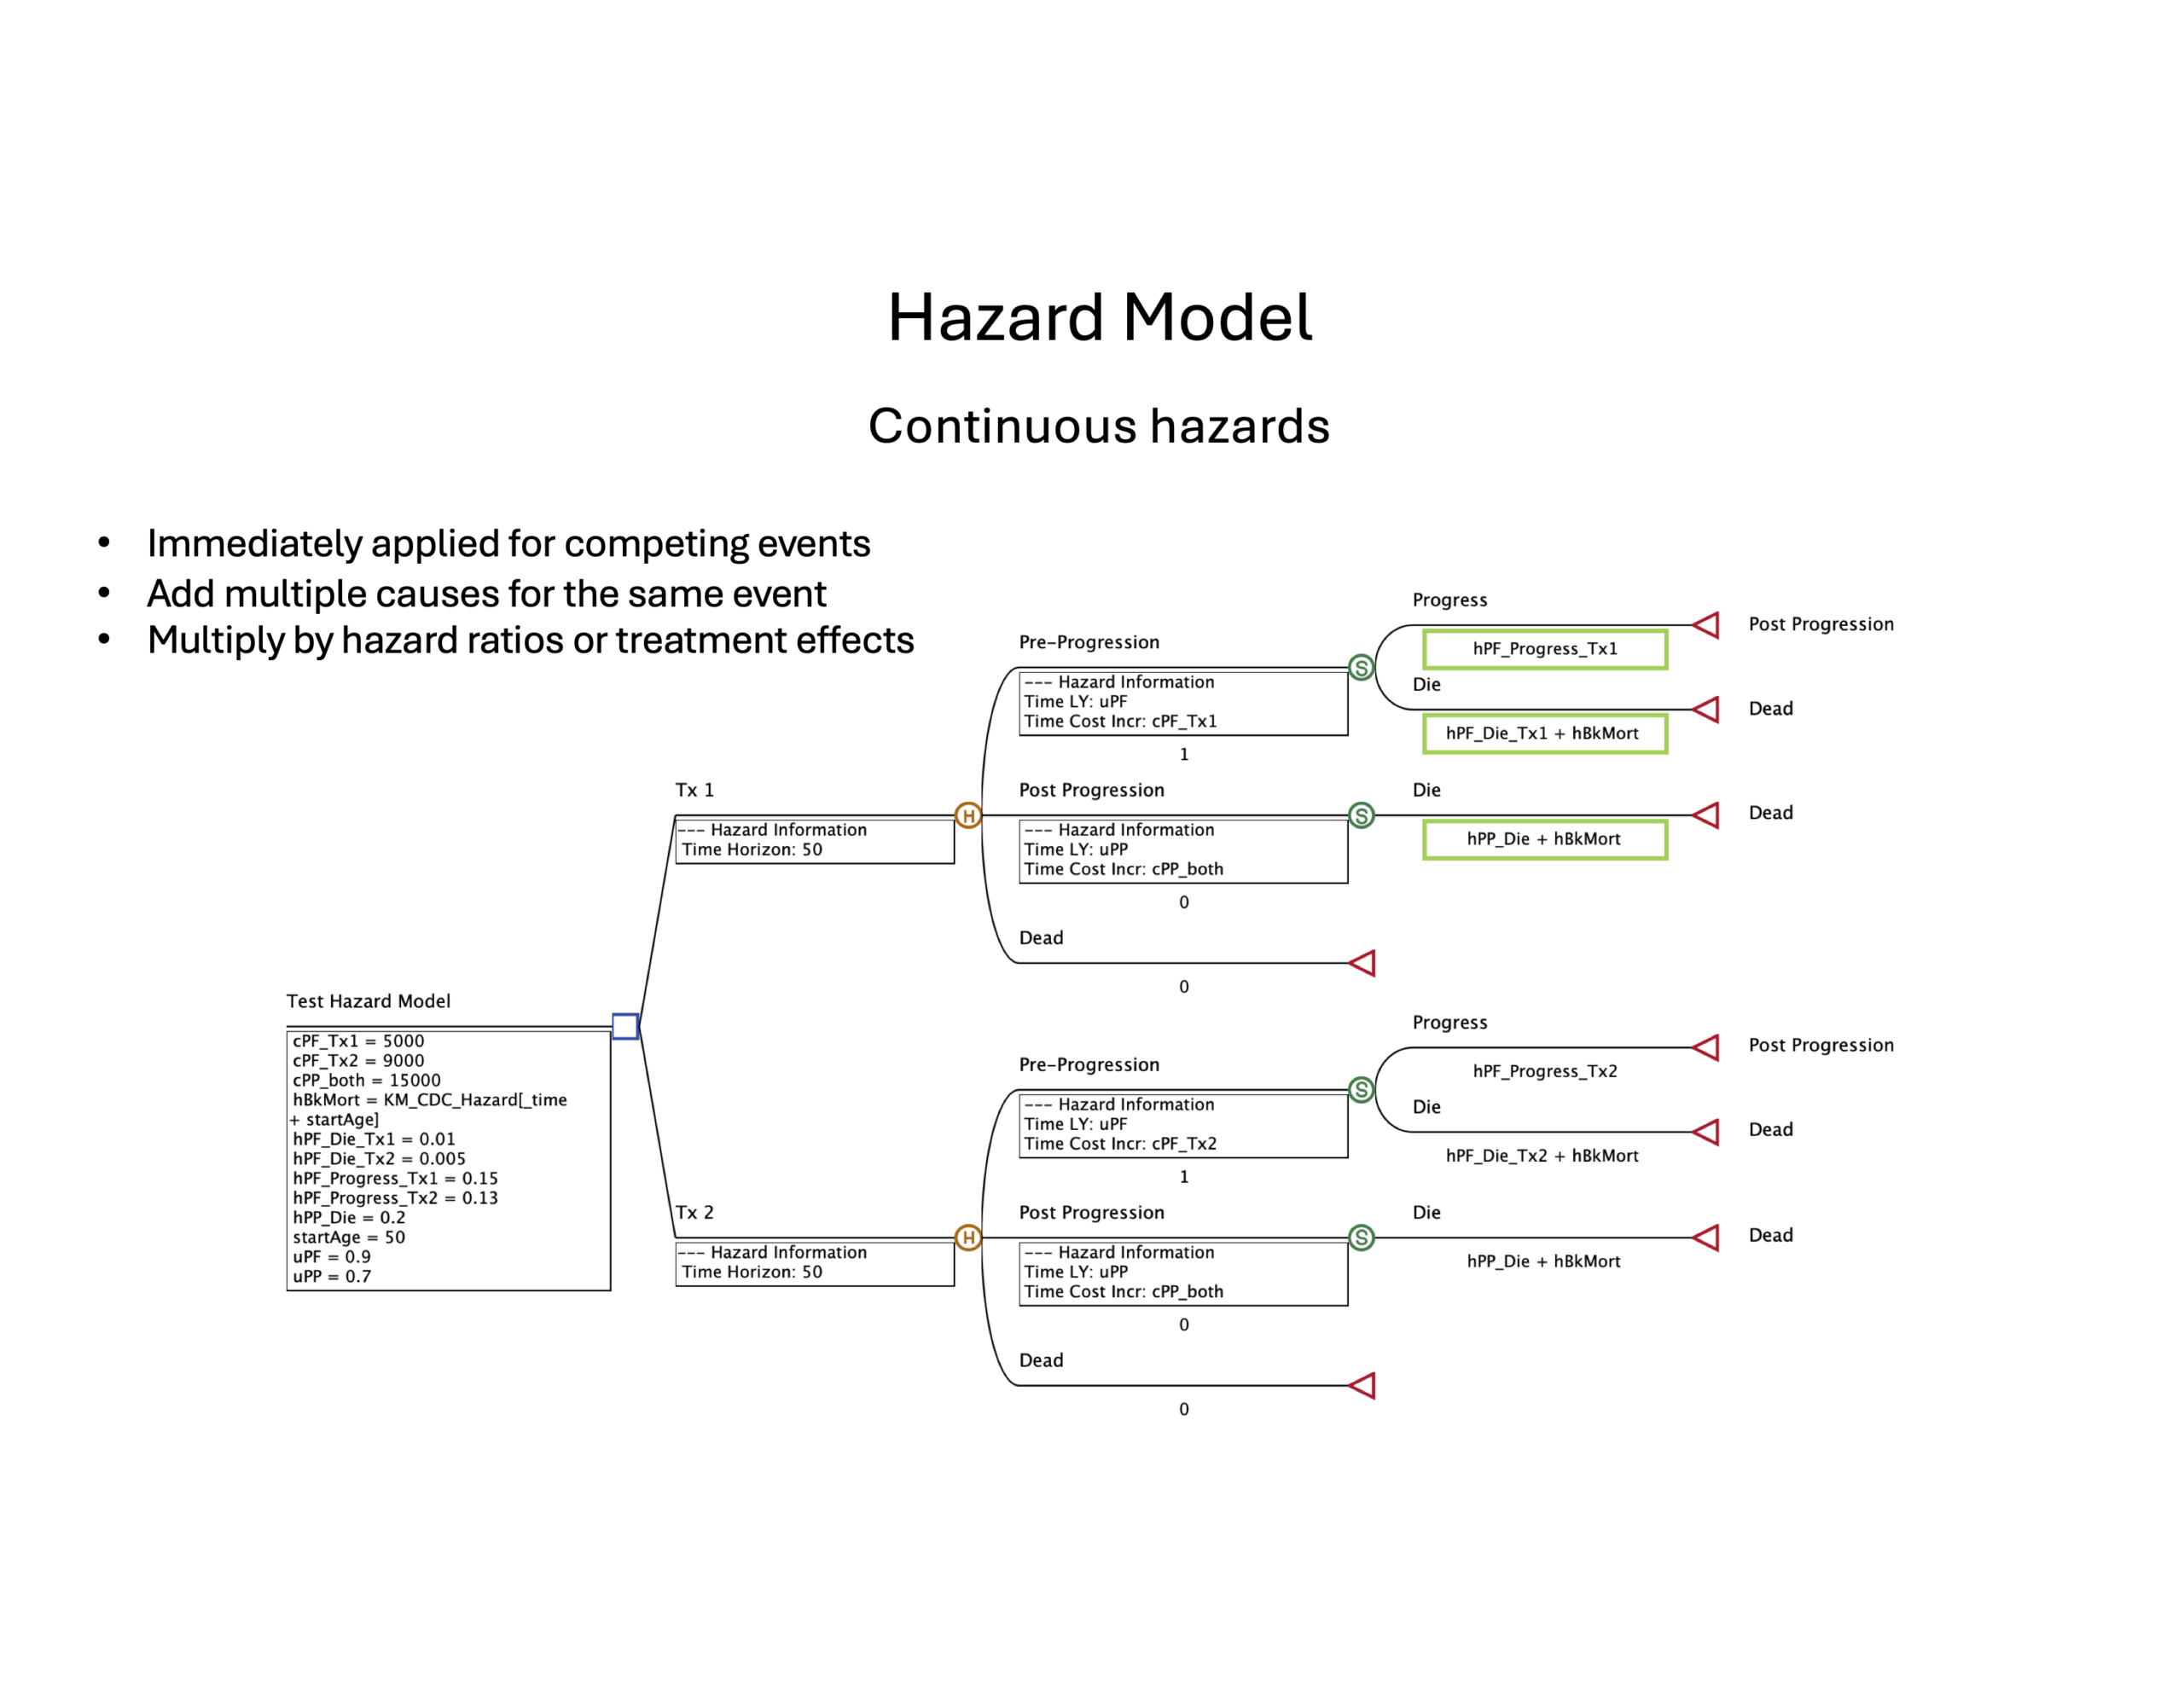
Build health economic models using continuous-time hazards within a familiar, Markov-like visual structure.
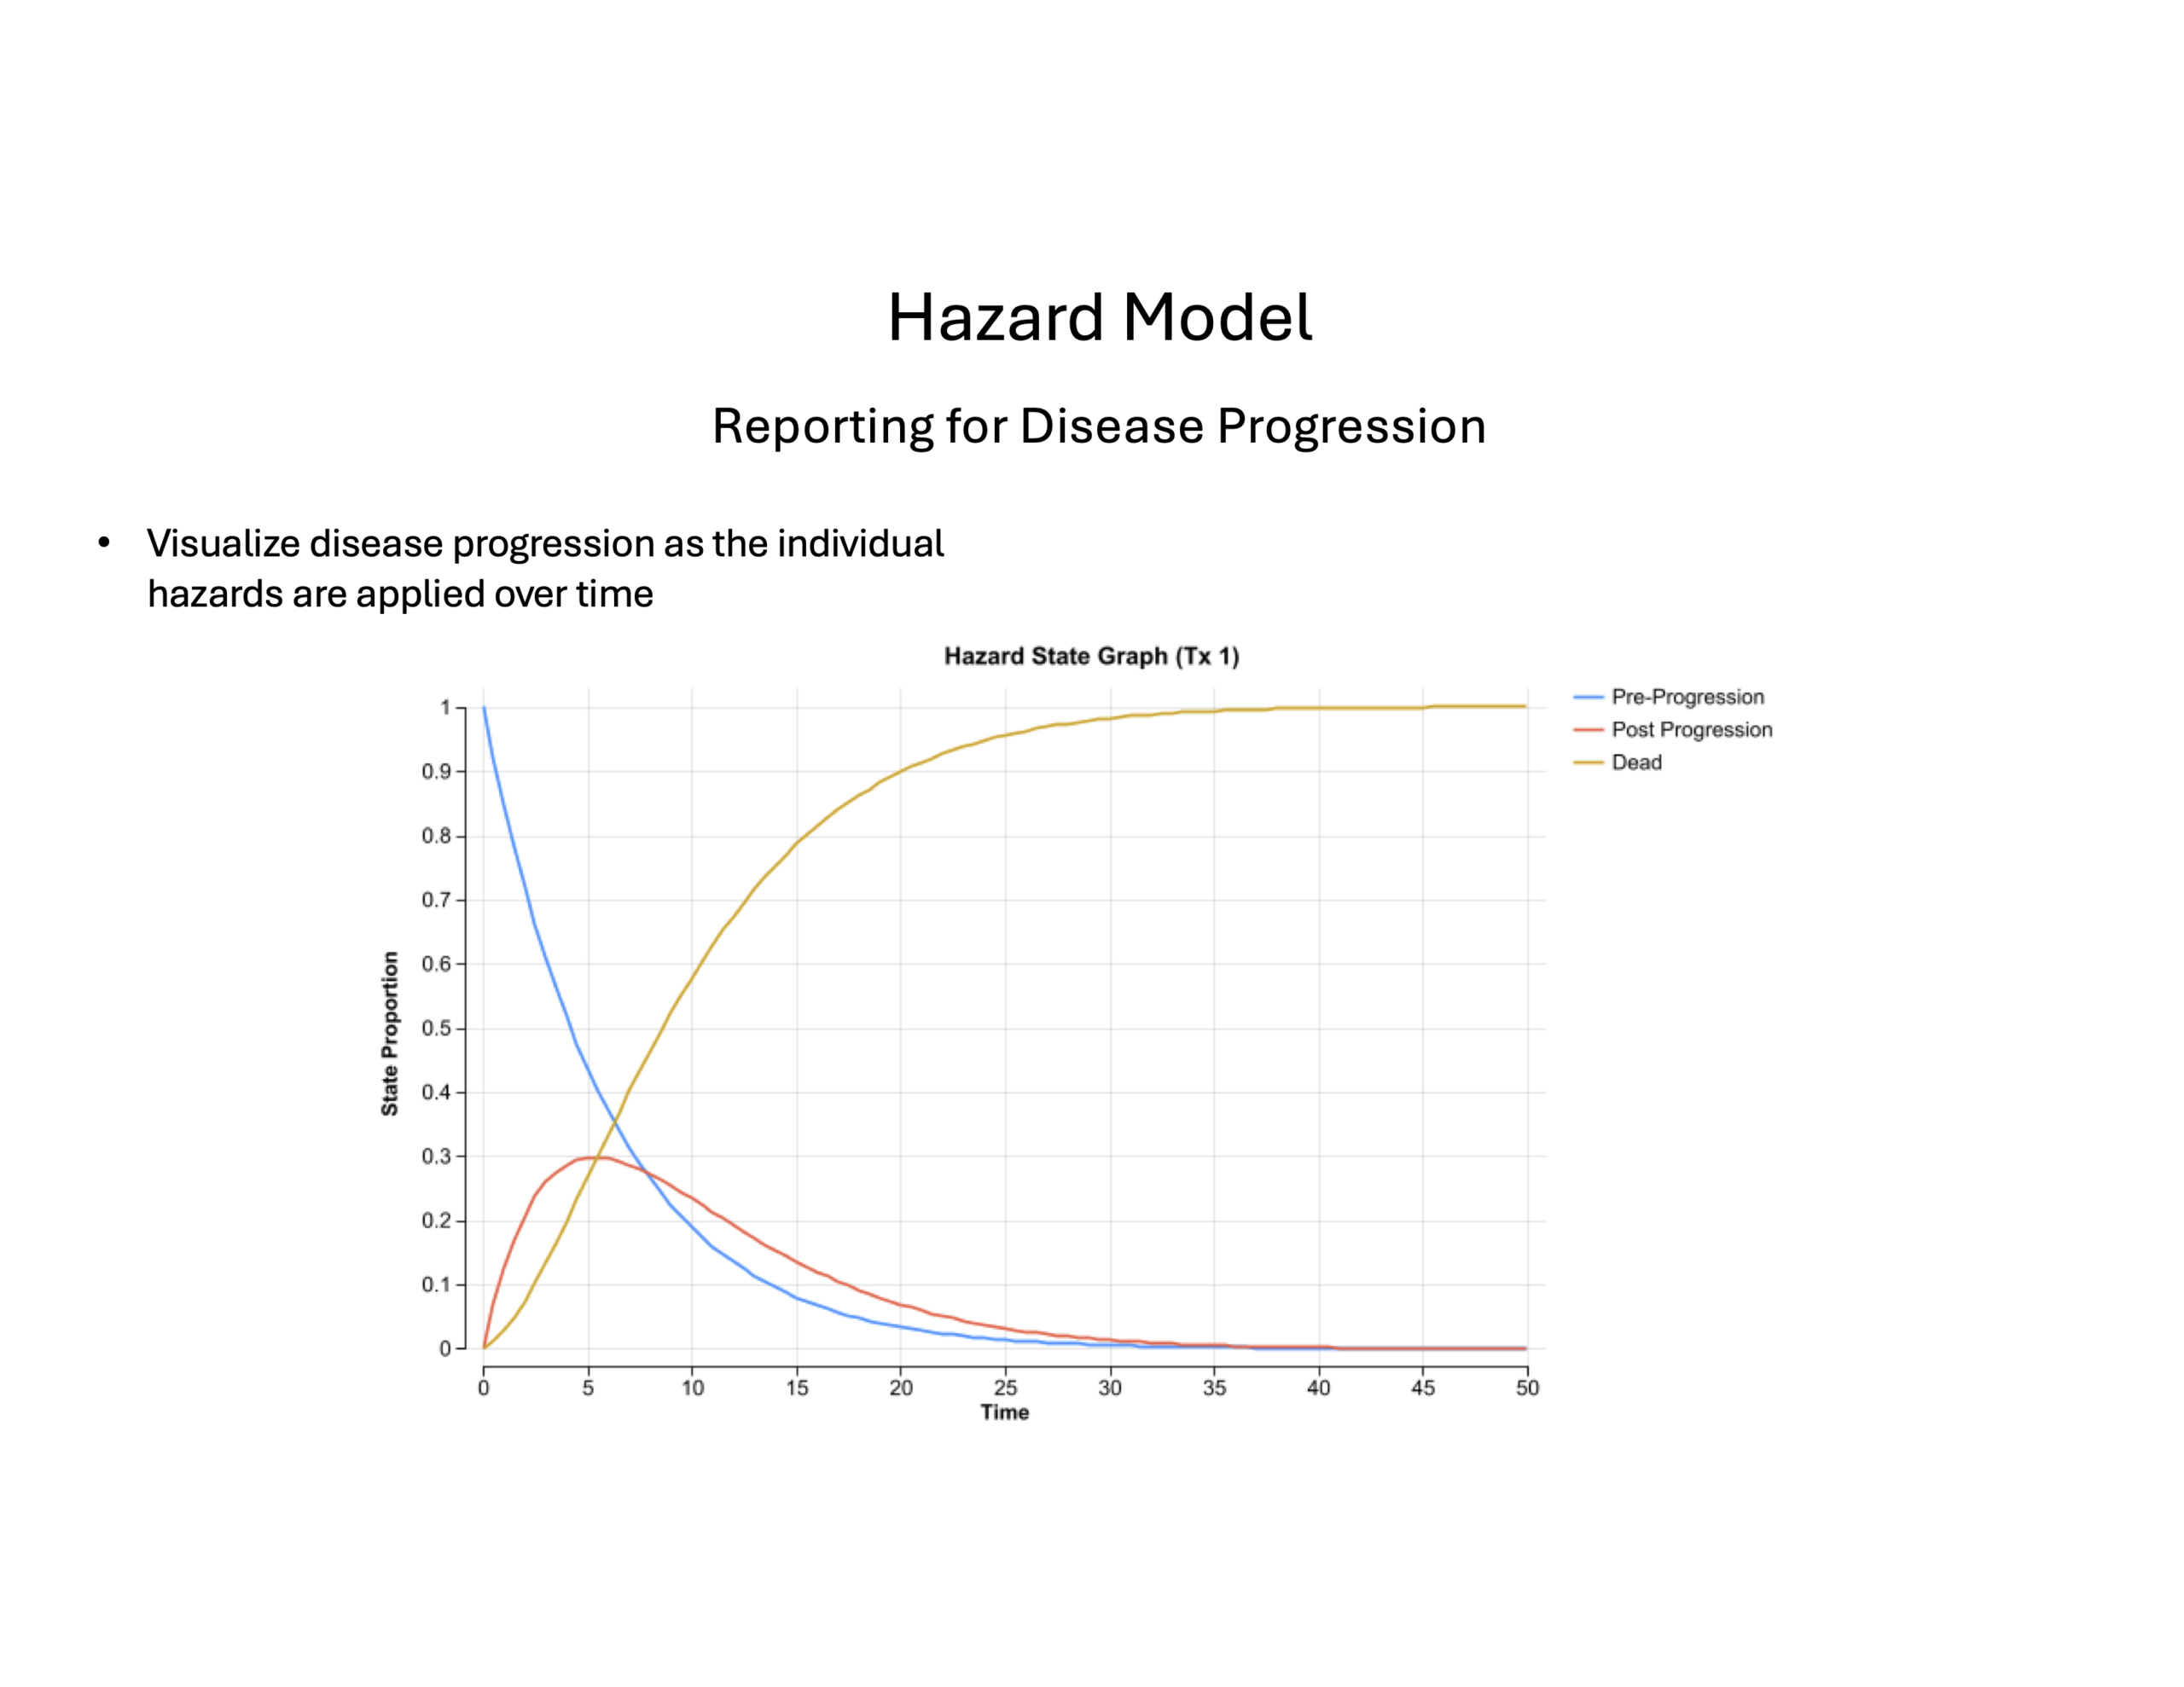
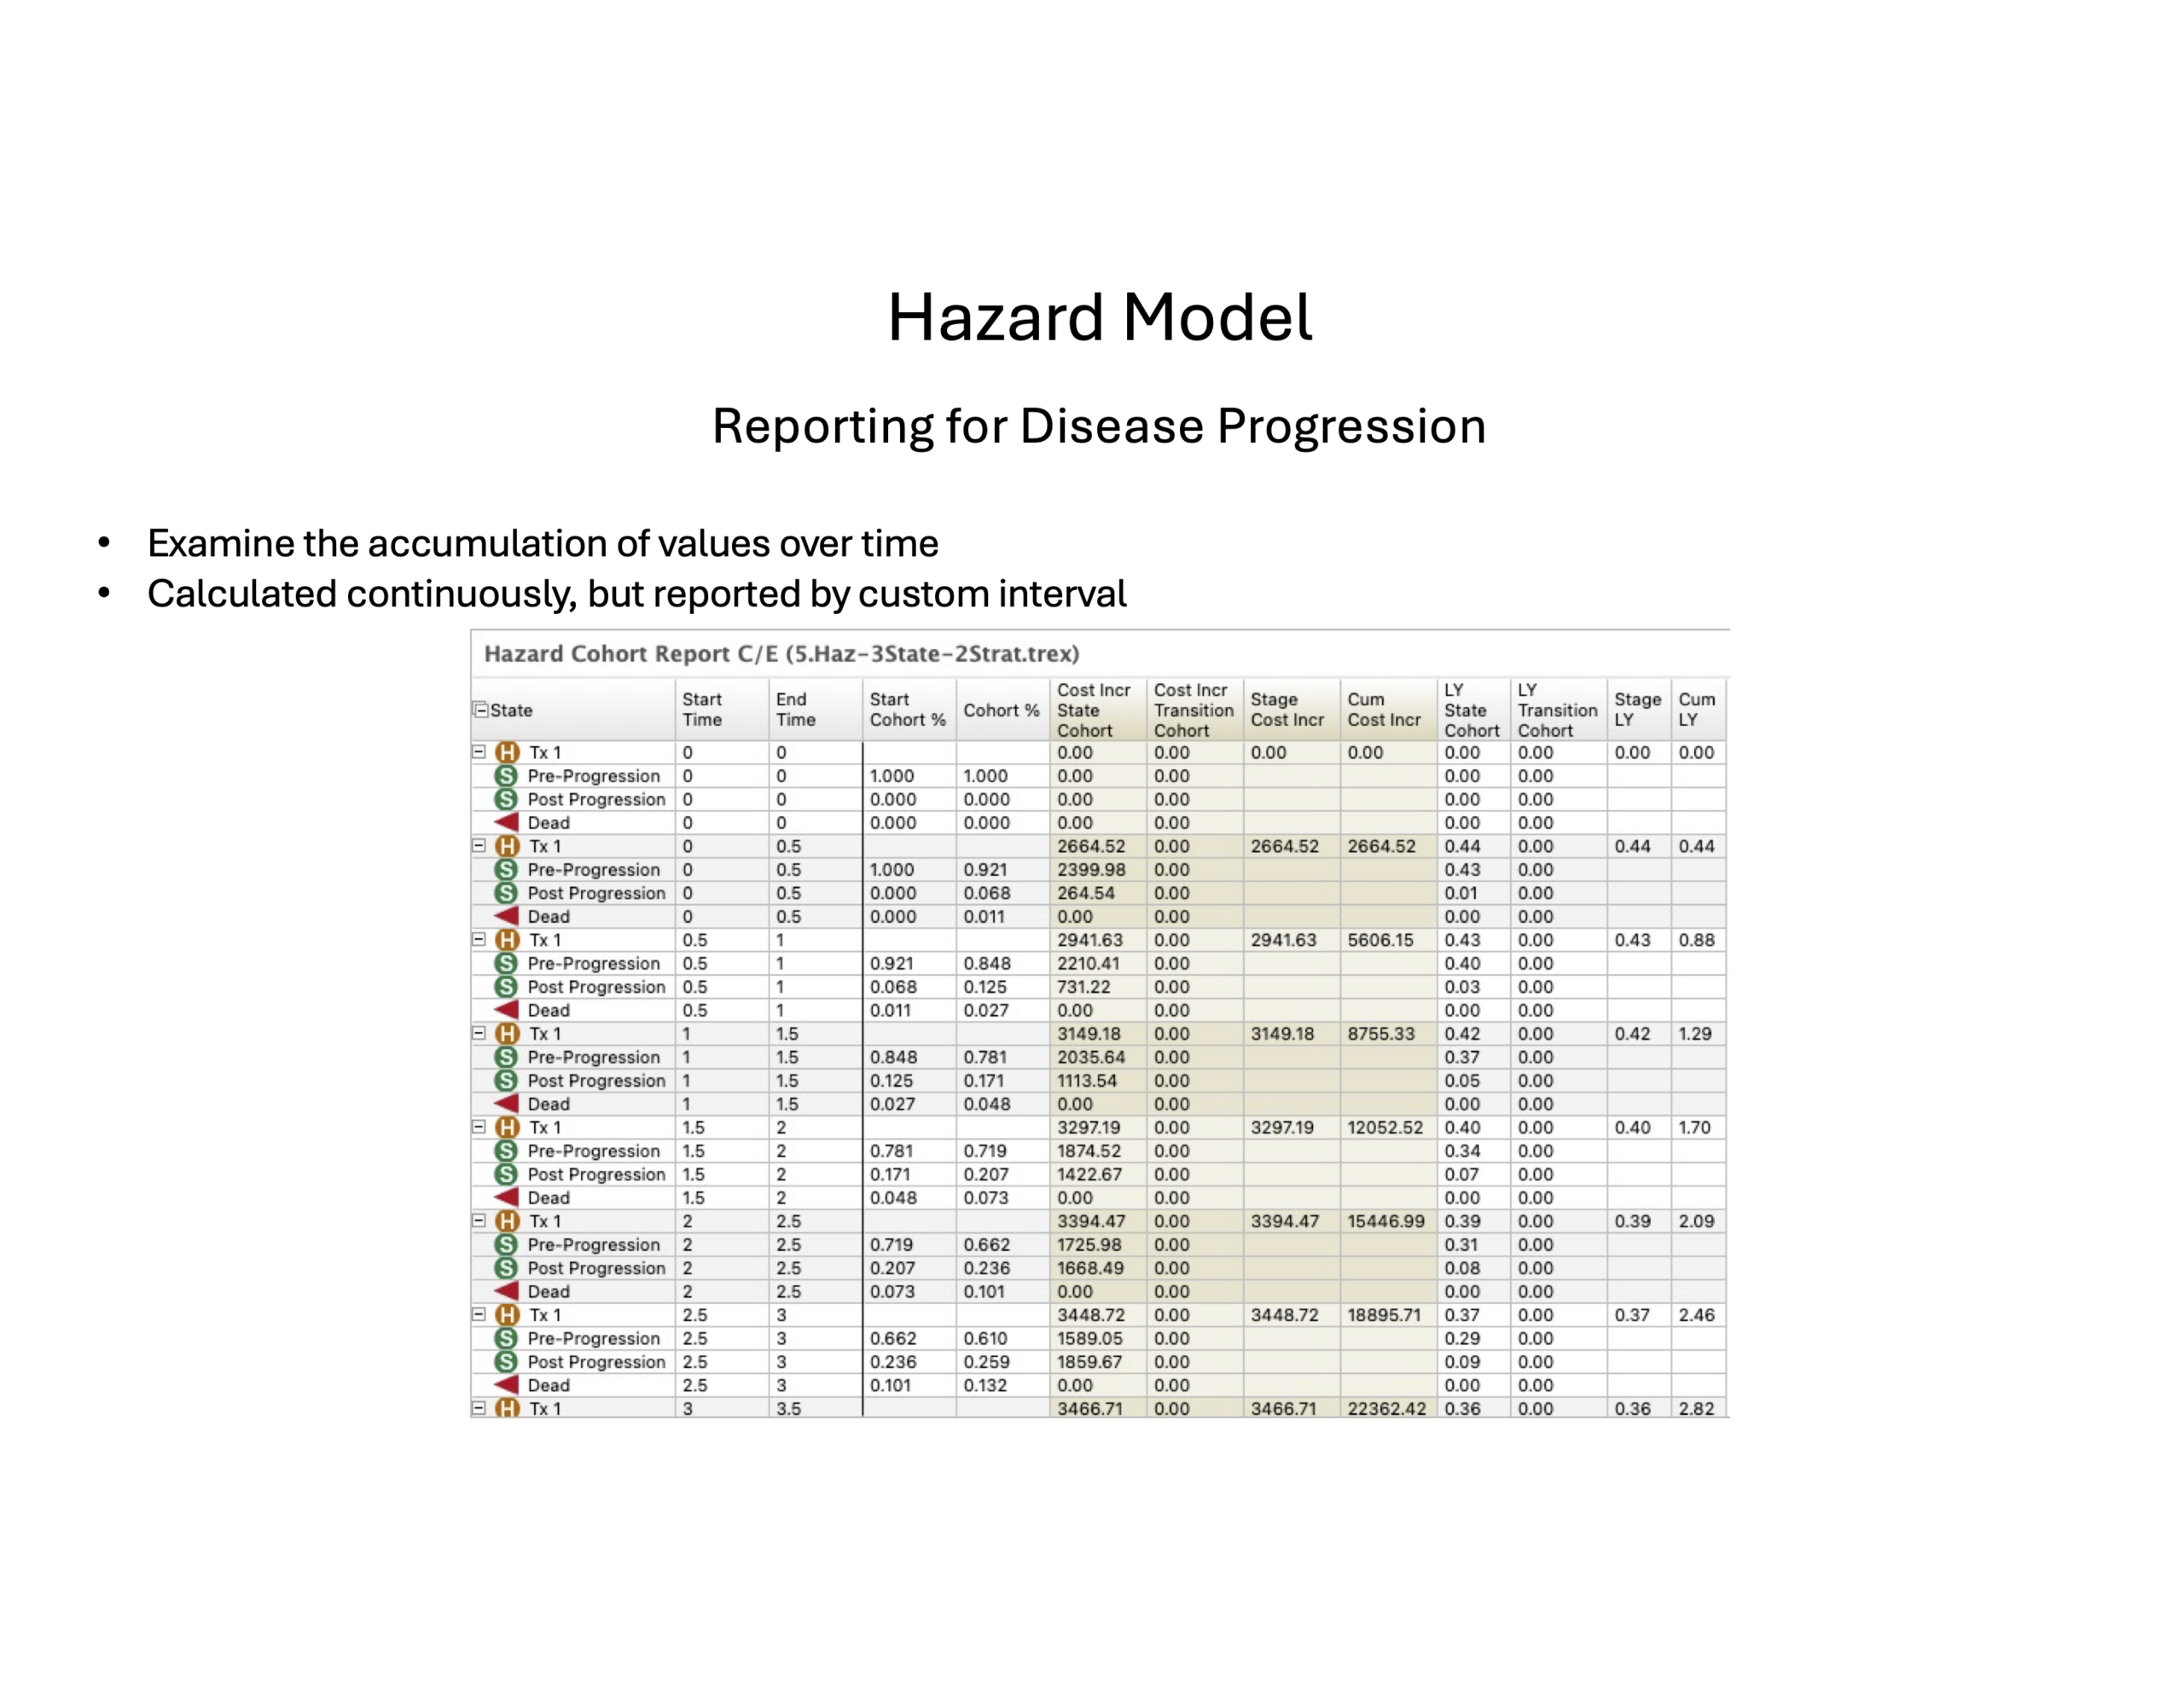
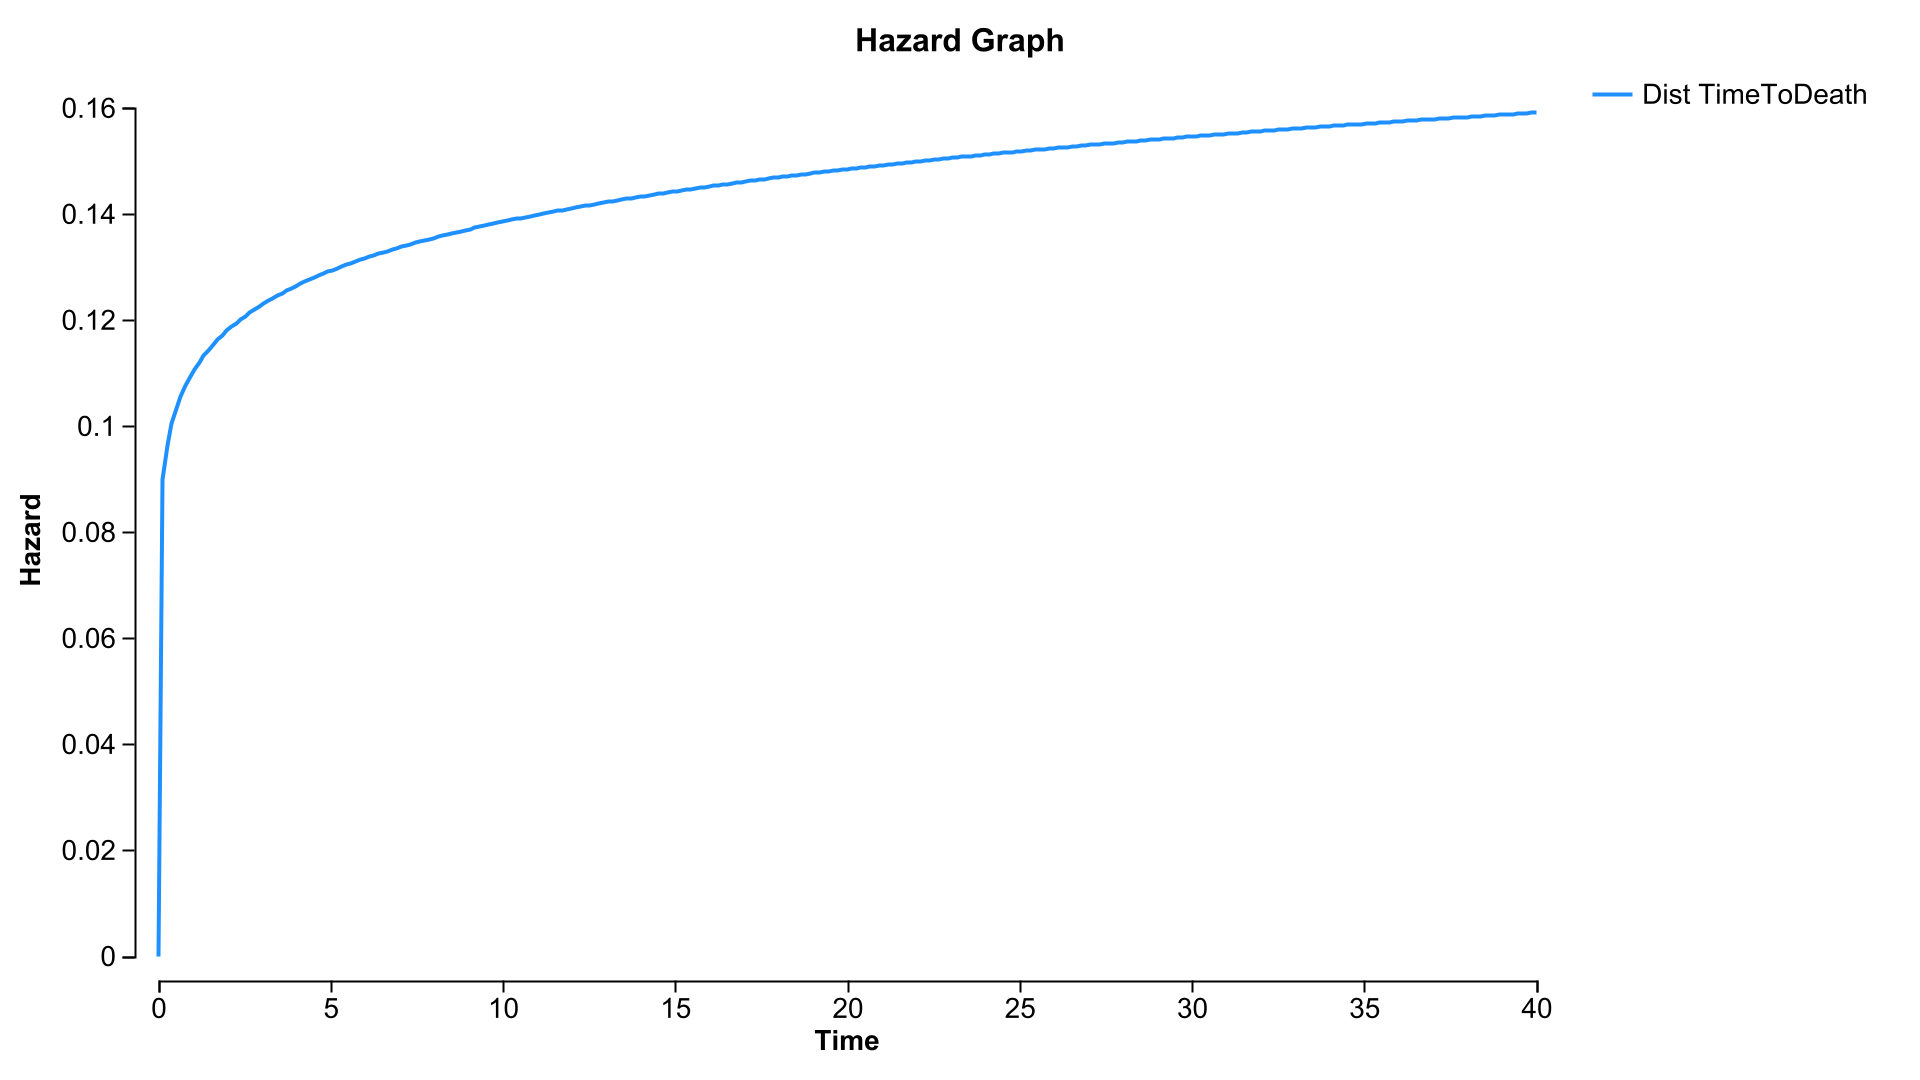
Hazard Models use continuous hazard rates to calculate changes in state occupancy over time, providing an alternative to traditional cycle-based Markov calculations.
Researchers can represent disease progression through continuous-time transitions while retaining the visual modeling environment and analytical capabilities of TreeAge Pro.
Enhanced Survival-to-Hazard Conversion *
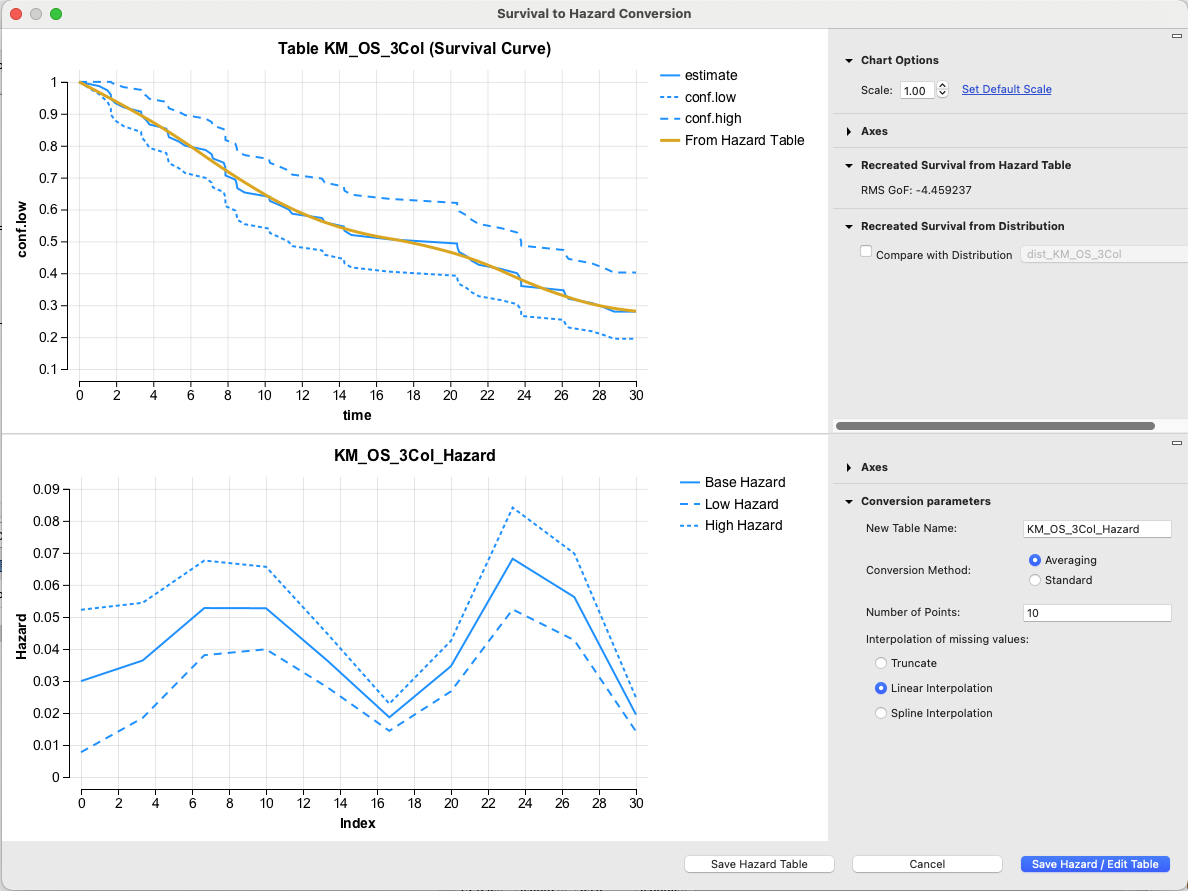
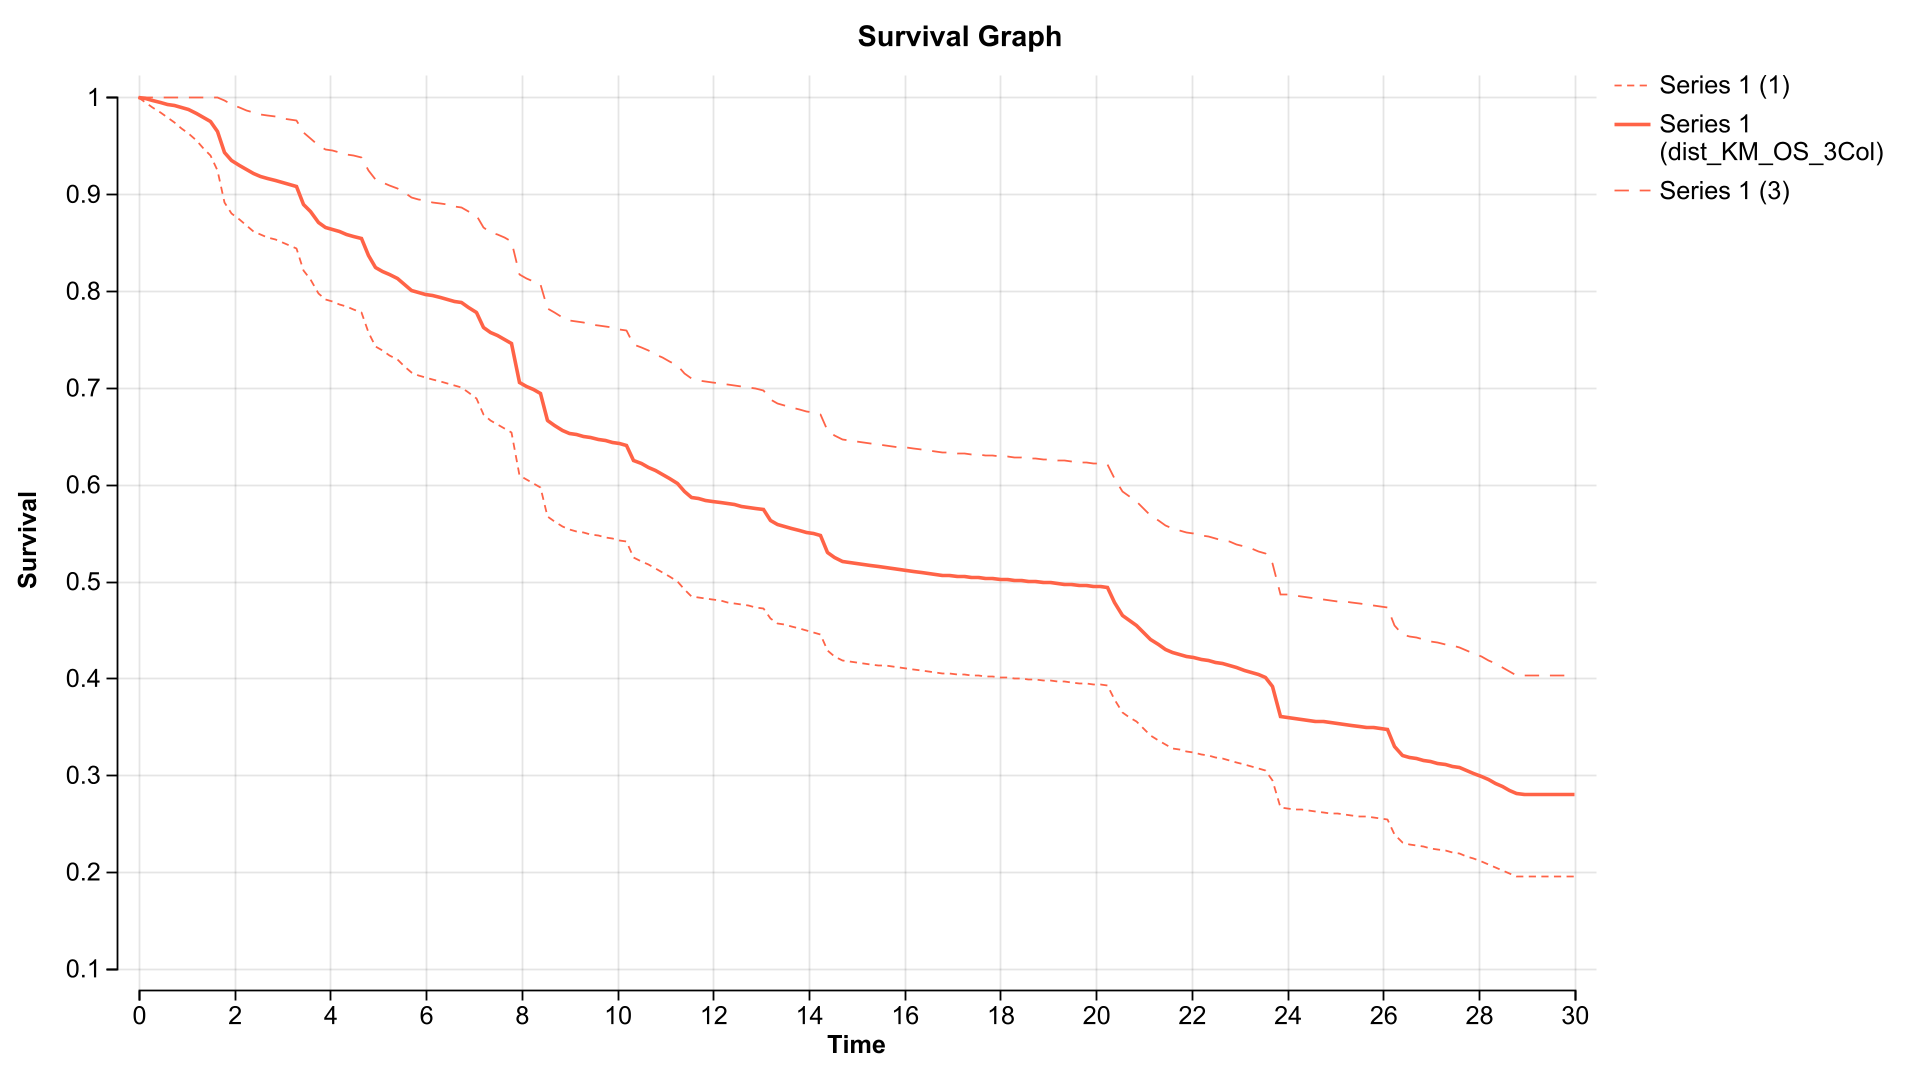
Convert low, best, and high survival estimates into corresponding hazard rates for sensitivity analysis.
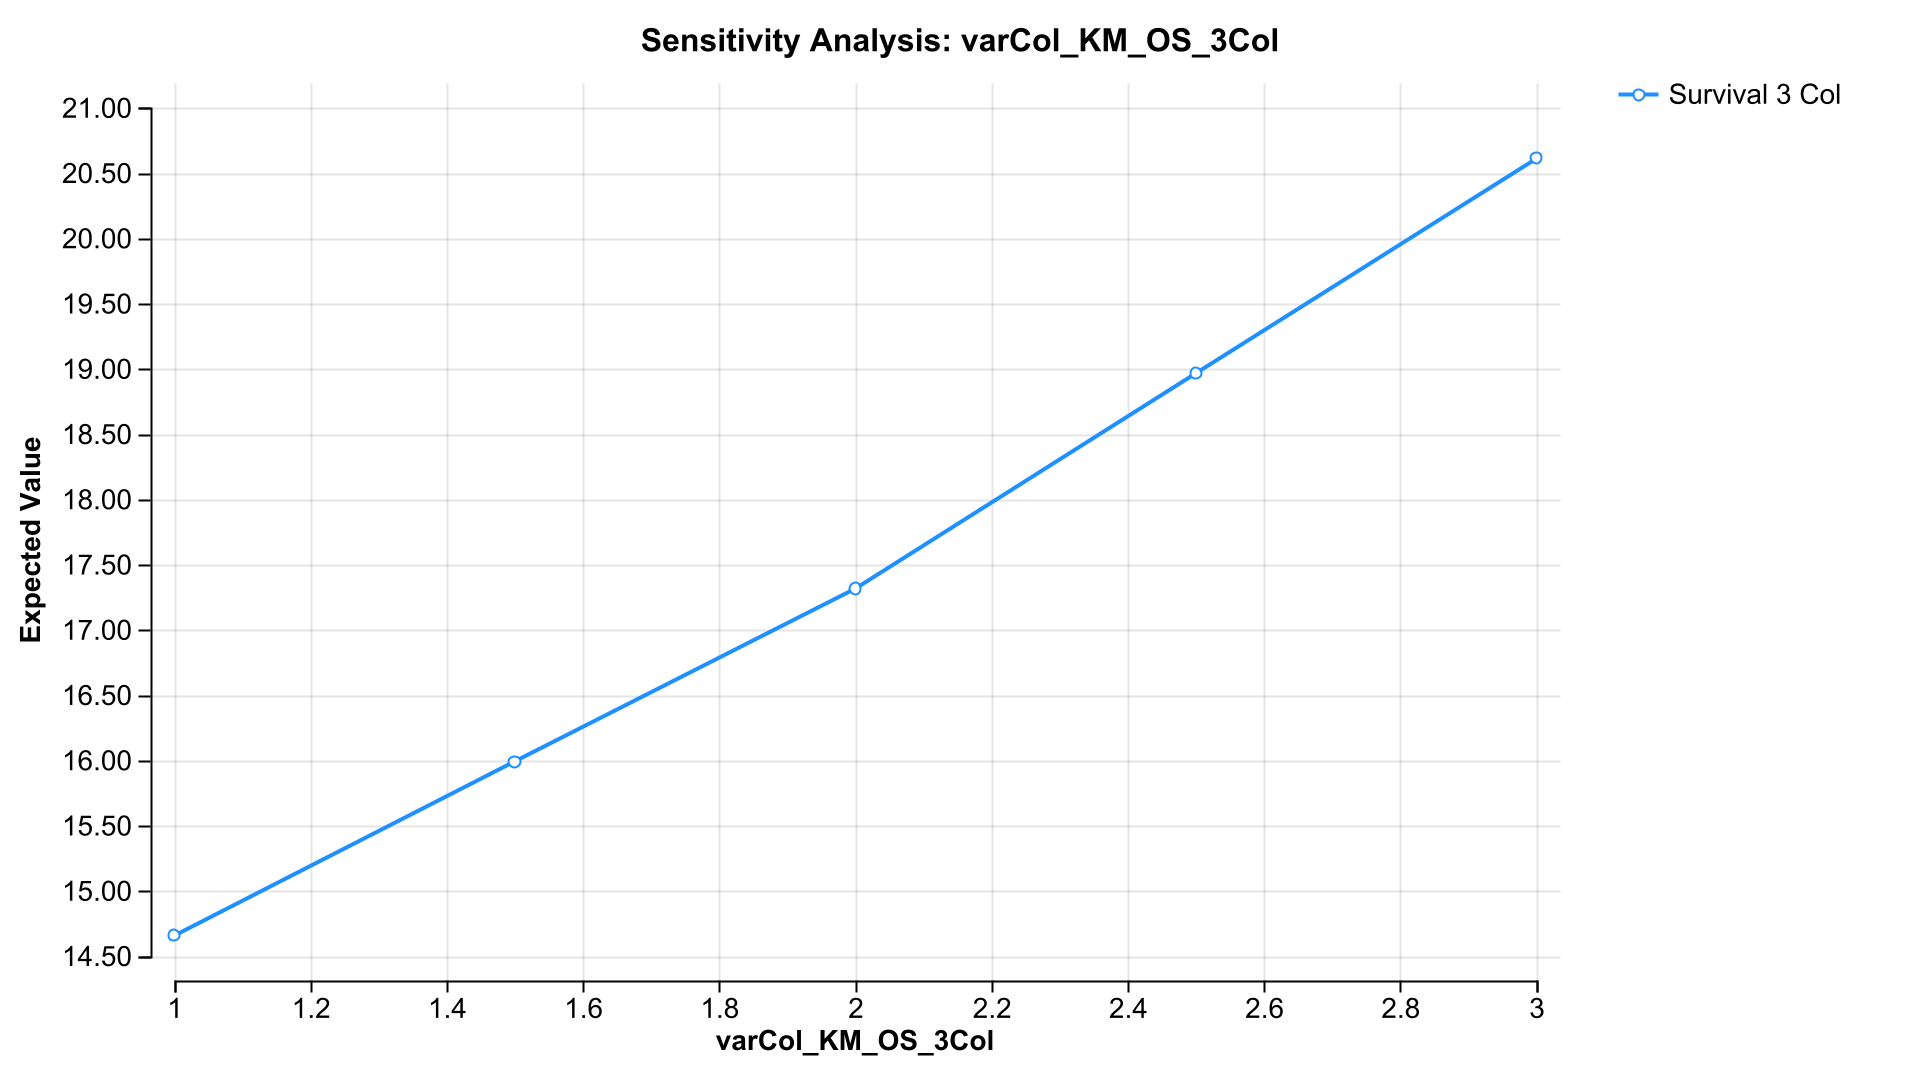
TreeAge Pro now supports converting all three survival estimates in a single table into corresponding hazard estimates. The resulting hazard curves can be displayed in the Survival Plot using sensitivity analysis mode, allowing researchers to visualize and compare alternative hazard profiles.
Prepare Survival and Hazard Tables for Sensitivity Analysis
Set up survival and hazard tables for sensitivity analysis with greater flexibility.
Building on the enhanced survival-to-hazard conversion capabilities, TreeAge Pro now supports preparing tables containing low, best, and high estimates for sensitivity analysis. The enhanced table preparation process automatically sets up the variables and distributions needed to explore uncertainty across multiple value columns.
Partitioned Survival Analysis Dashboard *
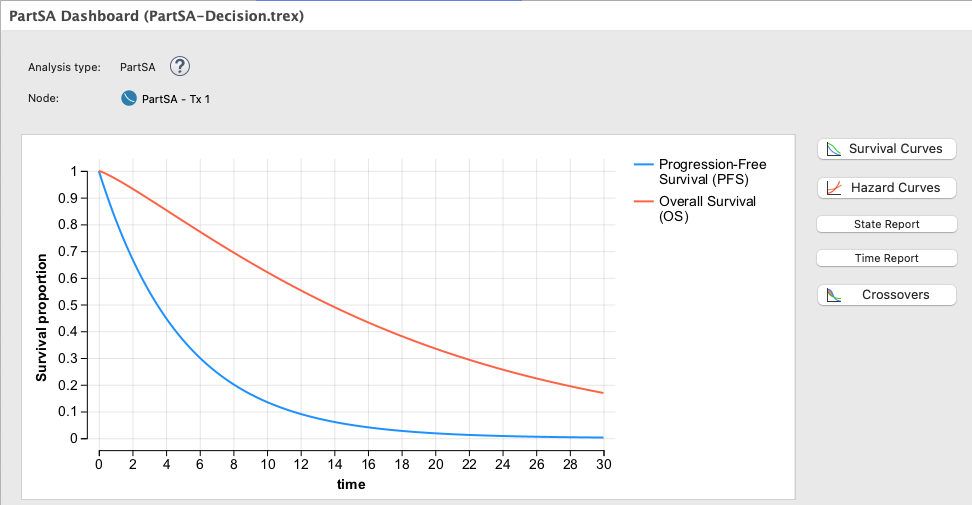
Explore partitioned survival model results through a new integrated analysis dashboard.
View survival curves and access hazard curves, state reports, time reports, and crossover analyses from a single location.
Bringing these analyses together makes it easier to investigate model behavior and understand how survival evidence translates into model outcomes.
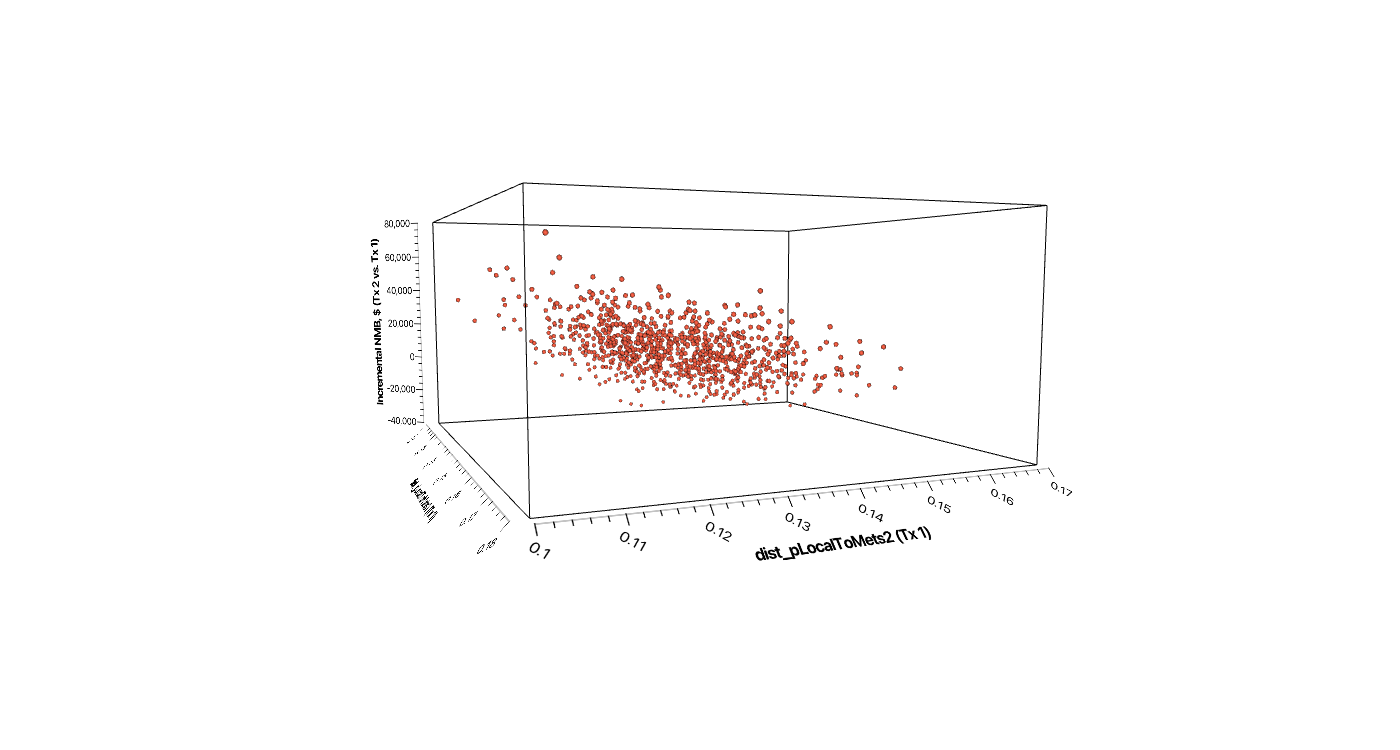
3D Scatterplots for Monte Carlo Simulation Results
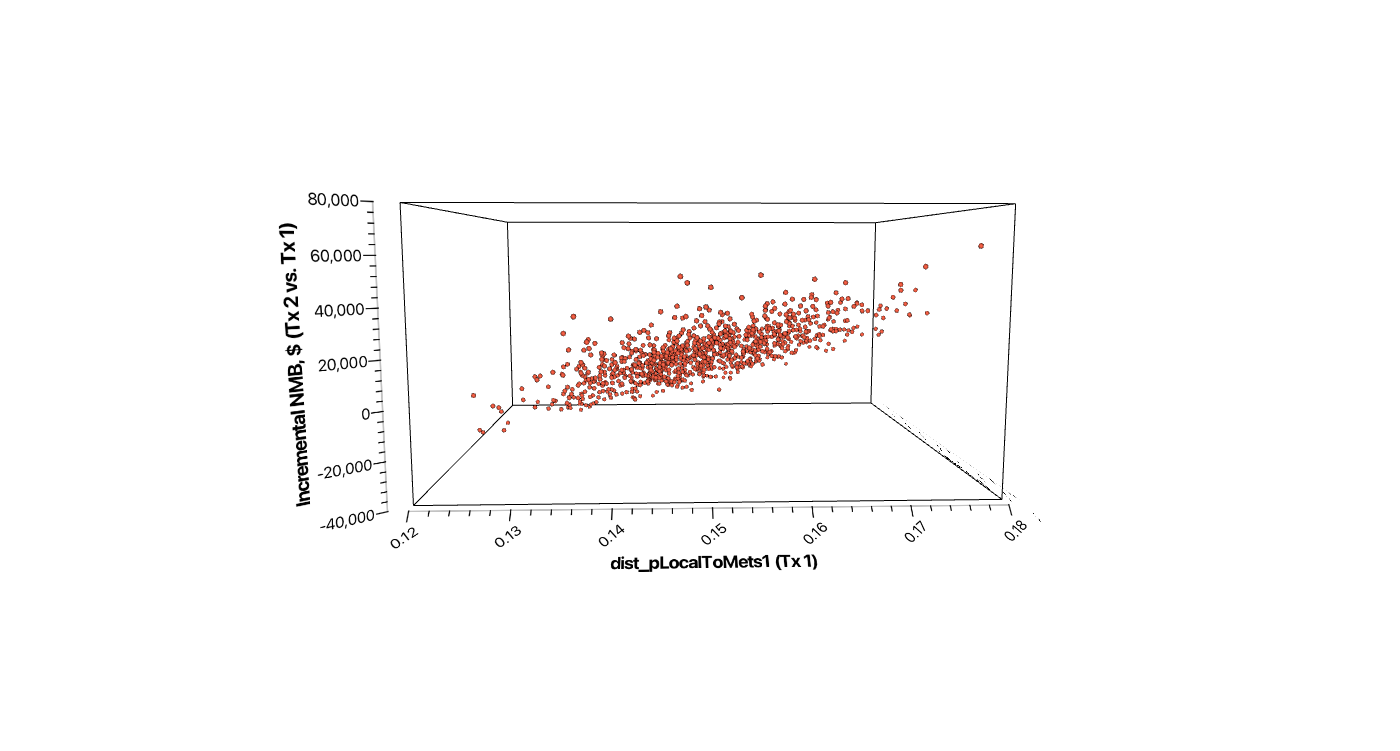
Explore Monte Carlo simulation results with customizable 3D scatterplots.
TreeAge Pro extends its custom scatterplot capabilities to three dimensions, allowing researchers to visualize relationships among three variables in a single graph. This additional perspective can help reveal relationships and patterns that may be difficult to identify in two-dimensional plots.
TreeAge Pro Business/Law
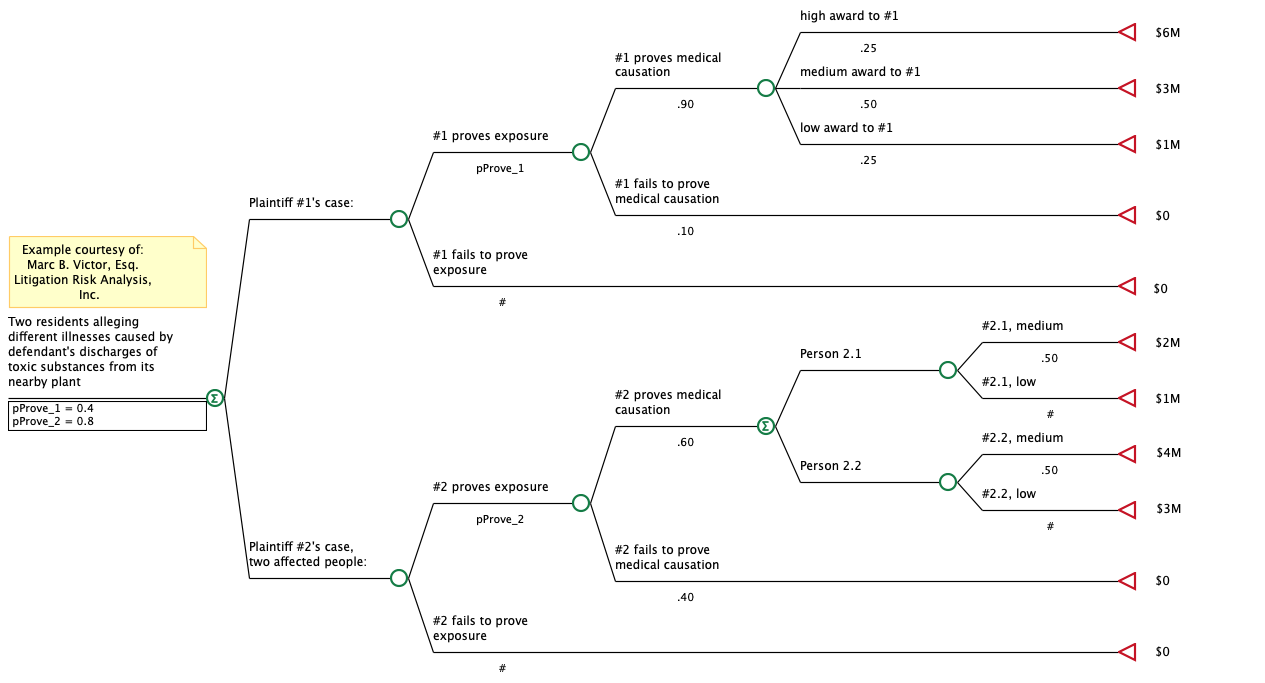
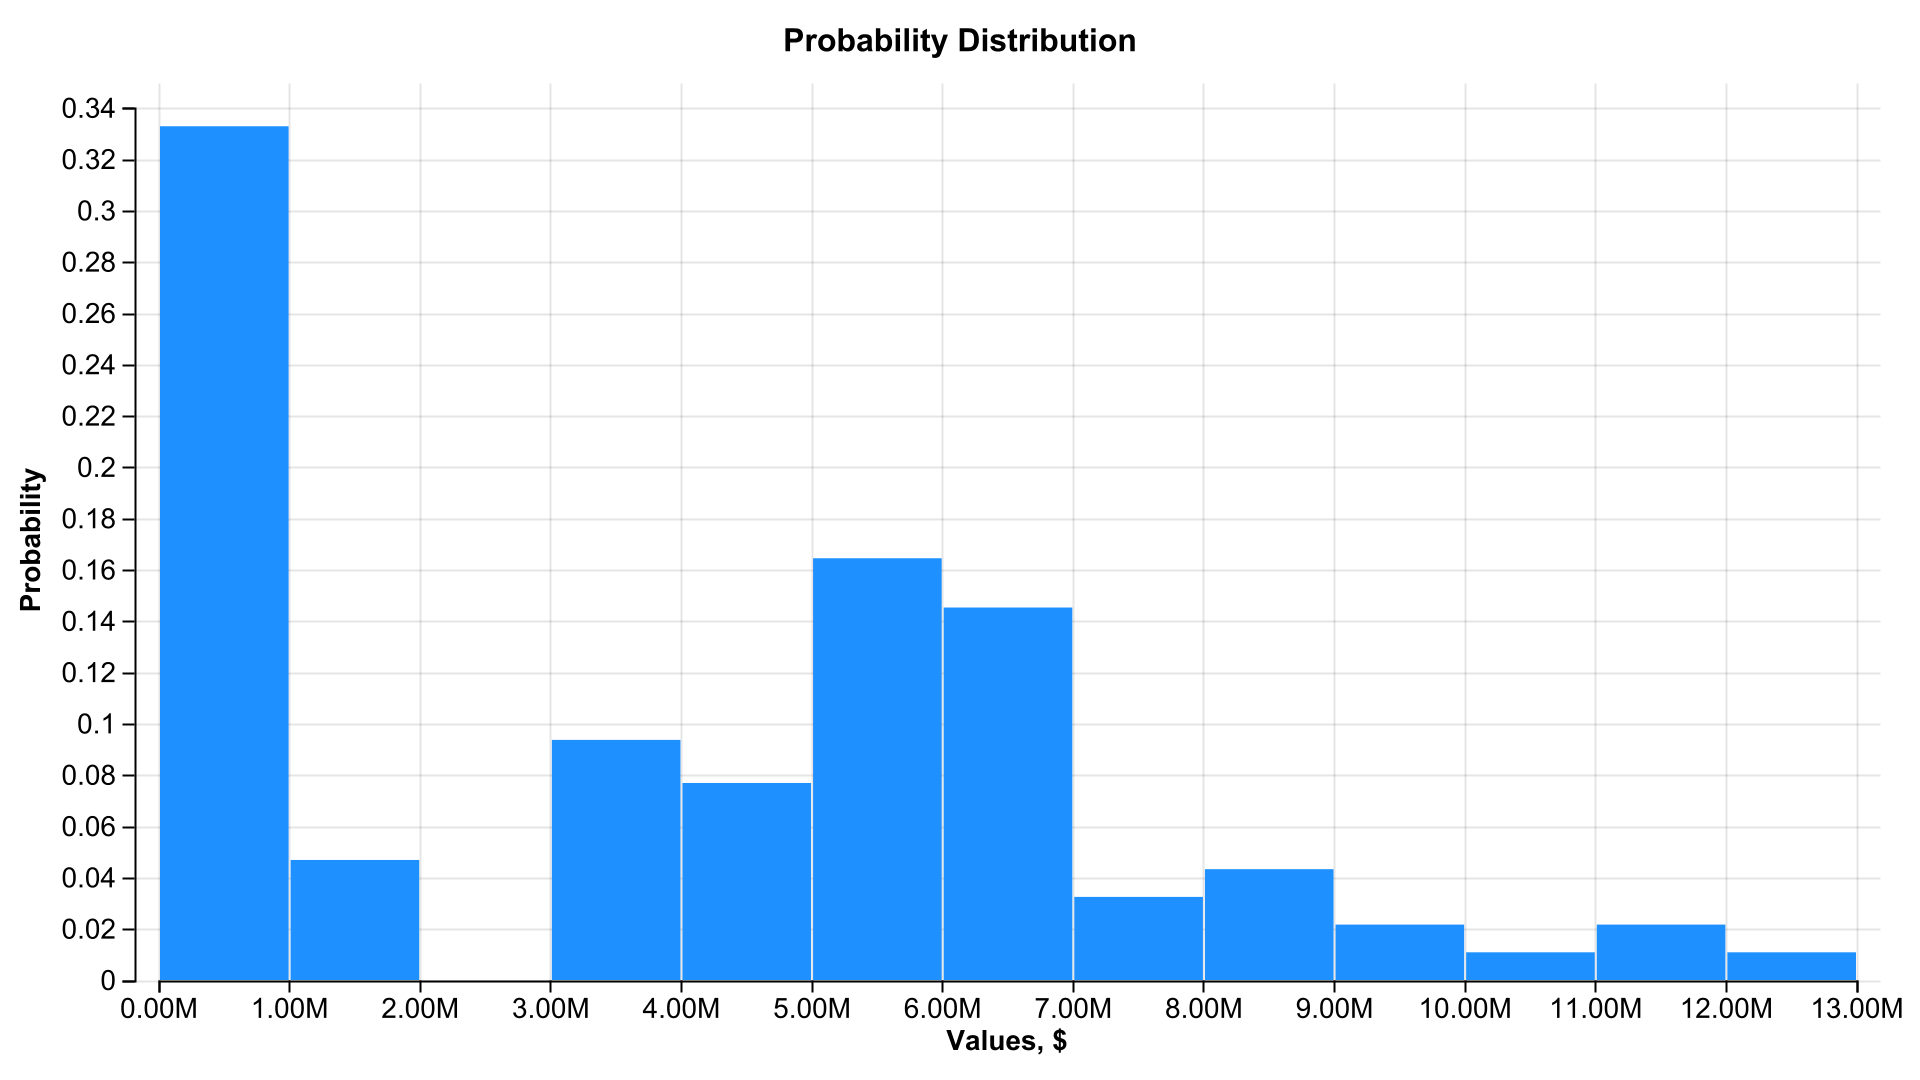
Probability Distribution Graphs for Summary Nodes
Create probability distribution graphs for models containing summary nodes.
TreeAge Pro Business/Law now supports combining outcomes from multiple summary node branches into a single probability distribution graph. This enhancement extends probability distribution analysis to more complex model structures, providing greater flexibility when exploring model outcomes.
TreeAge Pro Healthcare & Business/Law
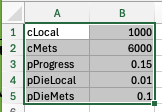
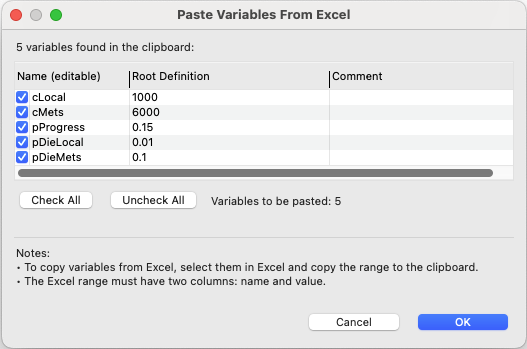
Copy Variables from Excel
Quickly transfer variable definitions from Excel into TreeAge Pro.
Copy two columns containing variable names and root definitions from an Excel spreadsheet and paste them directly into the TreeAge Pro Variables View. This experimental feature provides a convenient way to bring existing variable definitions into a model without entering them individually.
TreeAge Pro 2027 R1 is available to perpetual license holders that have a valid support contract and to annual license holders that have a valid license. Some features are not available on all license types and may require an active Support Contract for perpetual license holders.