TreeAge Pro Healthcare
- TreeAge Pro 2026 Feature Demo
- Presented as part of our webinar series.
- Click here for more webinar and videos.
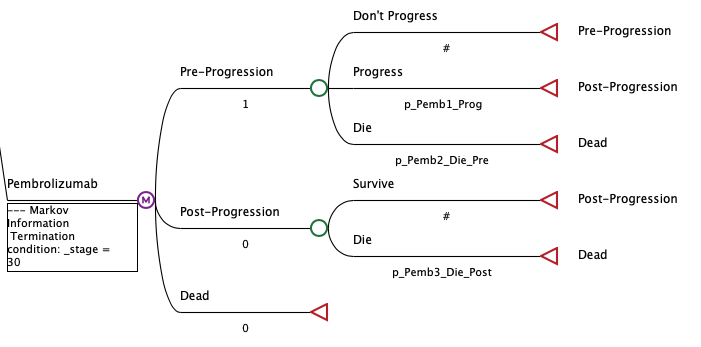
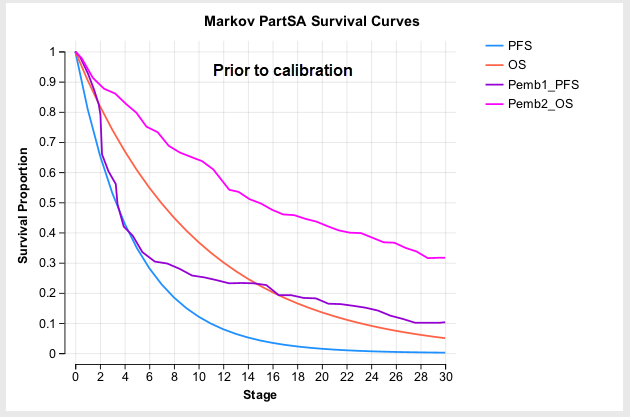
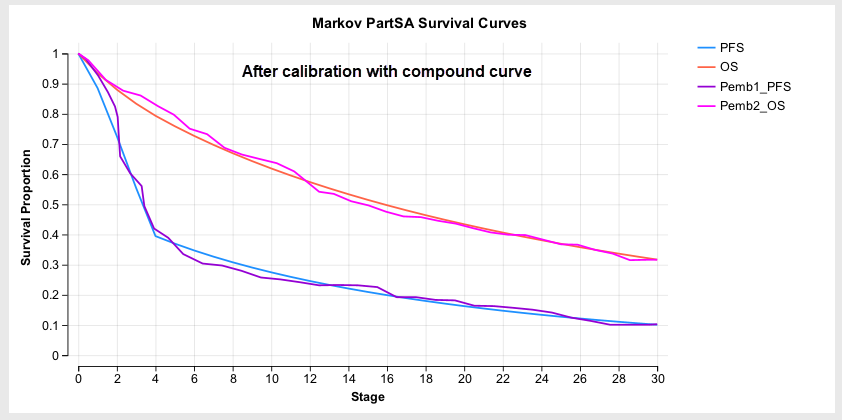
- Calibrate Markov Models with Clinical Data *
- Auto-calibrate your Markov model inputs so your model’s disease progression matches clinical survival data (K-M tables).
- After calibration, review model progression against clinical data with the Markov Plot.
- Continue to edit and refine your model structure and event risks then re-calibrate your model.
- Product Documentation
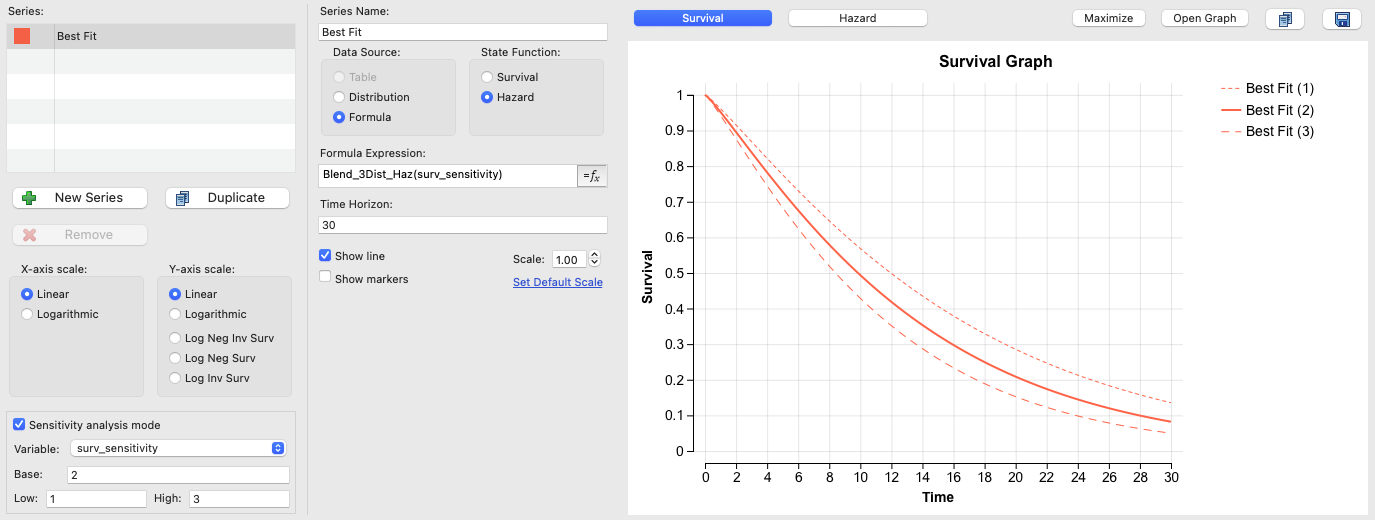
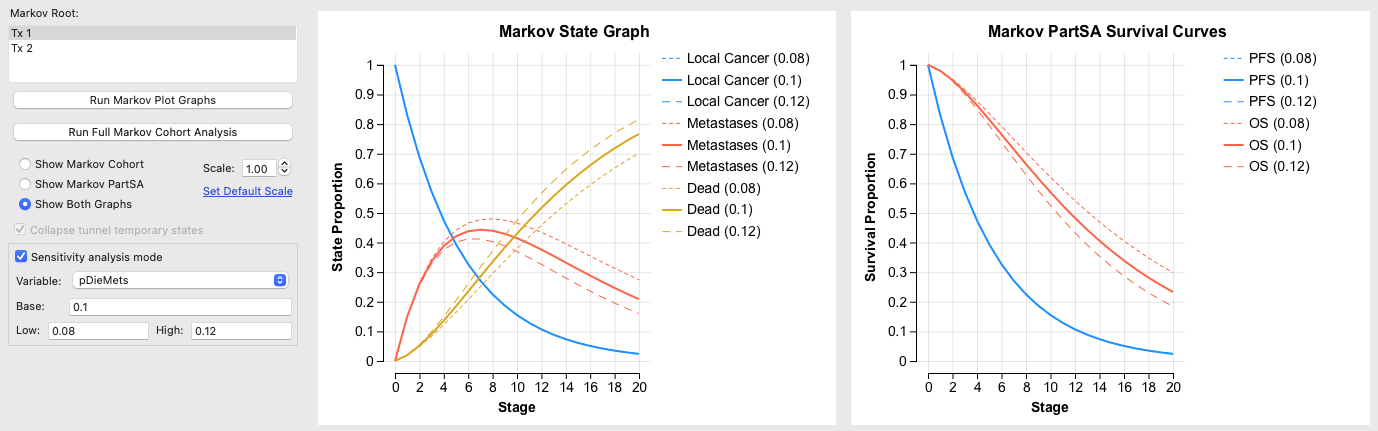
- Sensitivity Analysis Mode for the Markov Plot and Survival Plot
- Visualize the impact of uncertainty on survival in the two plots with sensitivity analysis mode.
- Choose an input variable and set its bounds to see survival at the input’s base case, low and high values.
- Product Documentation: Markov Plot, Survival Plot
- Latin Hypercube Sampling (for PSA)
- Use Latin Hypercube Sampling to improve the efficiency of parameter sampling for Probabilistic Sensitivity Analysis (PSA).
- Latin Hypercube divides the full parameter space into equal probability segments and chooses one sample from each segment.
- This allows a smaller number of parameter sample sets to better represent the full parameter space
- Product Documentation
- Markov Patient Tracking Cohort Dashboard
- Generate a cohort dashboard from Patient Simulation/Microsimulation > Patient Tracking > Cohort Reporting.
- This enables access to additional cohort-level reporting and collapse state options similar to Markov cohort models.
- Product Documentation
- Custom Simulation Scatterplots
- Generate 2-dimensional scatterplots for any two inputs and/or outputs from model simulations (Probabilistic Sensitivity Analysis and Patient Simulation).
- Examine relationships and correlations in your output by plotting any distribution, model output or incremental output as your graph axes.
- Product Documentation
- Calculate Event Probabilities from Tables and Compound Curves
- Calculate event probabilities directly from survival and hazard tables more easily with new table probability functions.
- ProbSurvTable – calculate an event probability from a survival table
- ProbHazardTable – calculate an event probability from a hazard table
- ProbSurvCompCurve – calculate an event probability from a survival compound curve
- ProbHazCompCurve – calculate an event probability from a hazard compound curve
- Product Documentation
TreeAge Pro Business
- Combine Probability Distribution Graphs
- Probability Distribution Graphs provide a visual representation of financial risk associated with a legal strategy.
- Combine Probability Distribution Graphs to assess the combined risk of two or more independent cases.
- Product Documentation
TreeAge Pro Web
- Control Node Width
- When viewing models, expand or contract the width of all nodes.
- Skip Node Generation Display
- Display model skip generation in TPWeb as it is displayed in TreeAge Pro desktop.
- Show Upstream Payoffs
- Display model payoffs beneath each node based on options from TreeAge Pro desktop.
TreeAge Pro 2026 R1 is available to perpetual license holders that have a valid support contract and to annual license holders that have a valid license. Some features are not available on all license types and may require an active Support Contract for perpetual license holders.